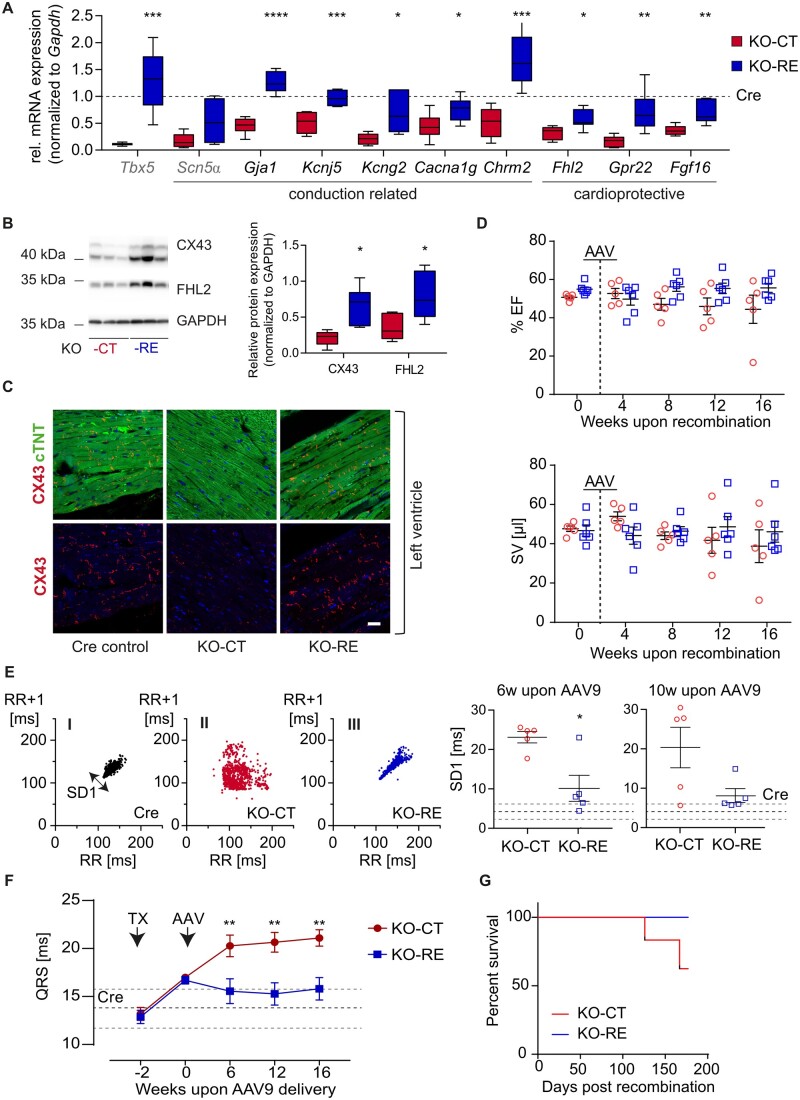
Figure 7.
In vivo TBX5 re-expression rescues arrhythmic phenotype of vTbx5KO mice while restoring TBX5-mediated transcription. (A) Transcript levels of newly identified ventricular TBX5 targets were analysed by RT-(q)PCR (KO-RE, TBX5-re-expression, blue, n = 7; KO-CT, control vector, red, n = 6 biological replicates). SCN5α was used as a known TBX5 target. All transcript values are normalized to the corresponding values from Cre controls, which are depicted with a dashed line. (B) Western blot analysis of CX43 and FHL2 protein levels normalized to GAPDH (KO-RE, n = 7; KO-CT n = 6 biological replicates). (C) Representative immunofluorescence analysis of CX43 in Cre, KO-CT, and KO-RE. Note the low expression of CX43 in KO-CT ventricles and its restoration in KO-RE hearts. (D) Echocardiography analysis parameters of KO-CT (red, n = 5 biological replicates) vs. KO-RE mice (blue, n = 6 biological replicates) monitored up to 14 weeks upon AAV9 injections. (E) Heart rate variability (HRV) represented by Poincaré plots; low variability in KO-RE indicates lower incidence of arrhythmia compared to KO-CT. One thousand consecutive beats were included per mouse/plot. The Poincaré plots were statistically analysed, the standard deviation of the HRV (SD1) was clearly increased in KO-CT mice (suggestive of arrhythmias) and remained comparable to Cre control mice after AAV9- transduction (KO-RE). Dashed lines indicated Cre mean values ± SEM. Statistical analysis of SD1 from HRV analysis shows significantly lower HRV in KO-RE vs. KO-CT mice. (n = 5 biological replicates per group). (F) QRS interval in KO-RE mice is significantly lower than KO-CT at 6, 12, and 16 weeks after TBX5 AAV9 injections. (G) Survival curve of KO-RE vs. KO-CT mice (KO-CT and KO-RE n = 5 and n = 6 biological replicates, respectively). Statistical analysis was performed by (A, B, E) unpaired, two-tailed Student’s t-test; (F) two-way ANOVA followed by Sidak’s multiple comparison post hoc test. *P < 0.05, **P < 0.01, ***P < 0.001, ****P < 0.0001.

