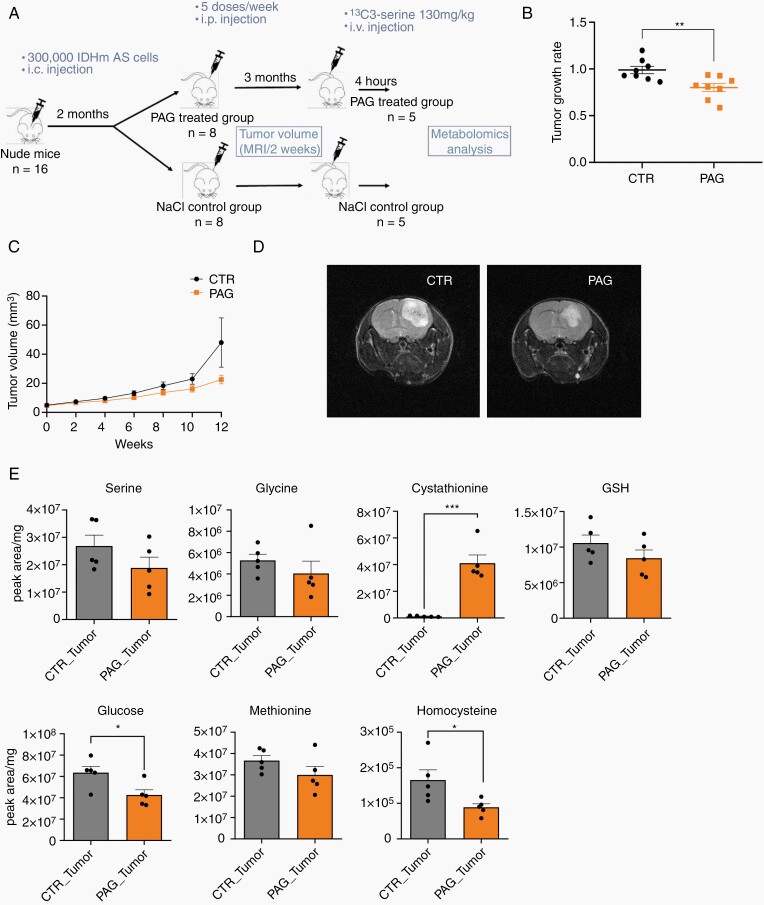
Figure 5.
CSE inhibition delays tumor growth in vivo. (A) Setup of in vivo experiment. (B) Tumor growth rate of CTR and PAG-treated mice during the first 8 weeks of treatment (n = 8). (C) Tumor volume over time during the 3 months treatment period as determined by MRI (n = 8; except for CTR, where n = 7 at weeks 8/10 and n = 6 at week 12). Tendency to reduced volume at week 12 (not significant). Note that 2 CTR mice died after week 8. (D) Representative MRI pictures at week 12. (E) Total metabolite levels represented as normalized peak area in CTR and PAG-treated tumors after 12 weeks of treatment (n = 5). Each dot in charts B and E correspond to different mice. Data presented as means ± SEM. *P < .05; **P < .01; ***P < .001.

