
Extended Data Figure 6: The effect of aneuploidy on cellular sensitivity to SACi in isogenic human cell lines.
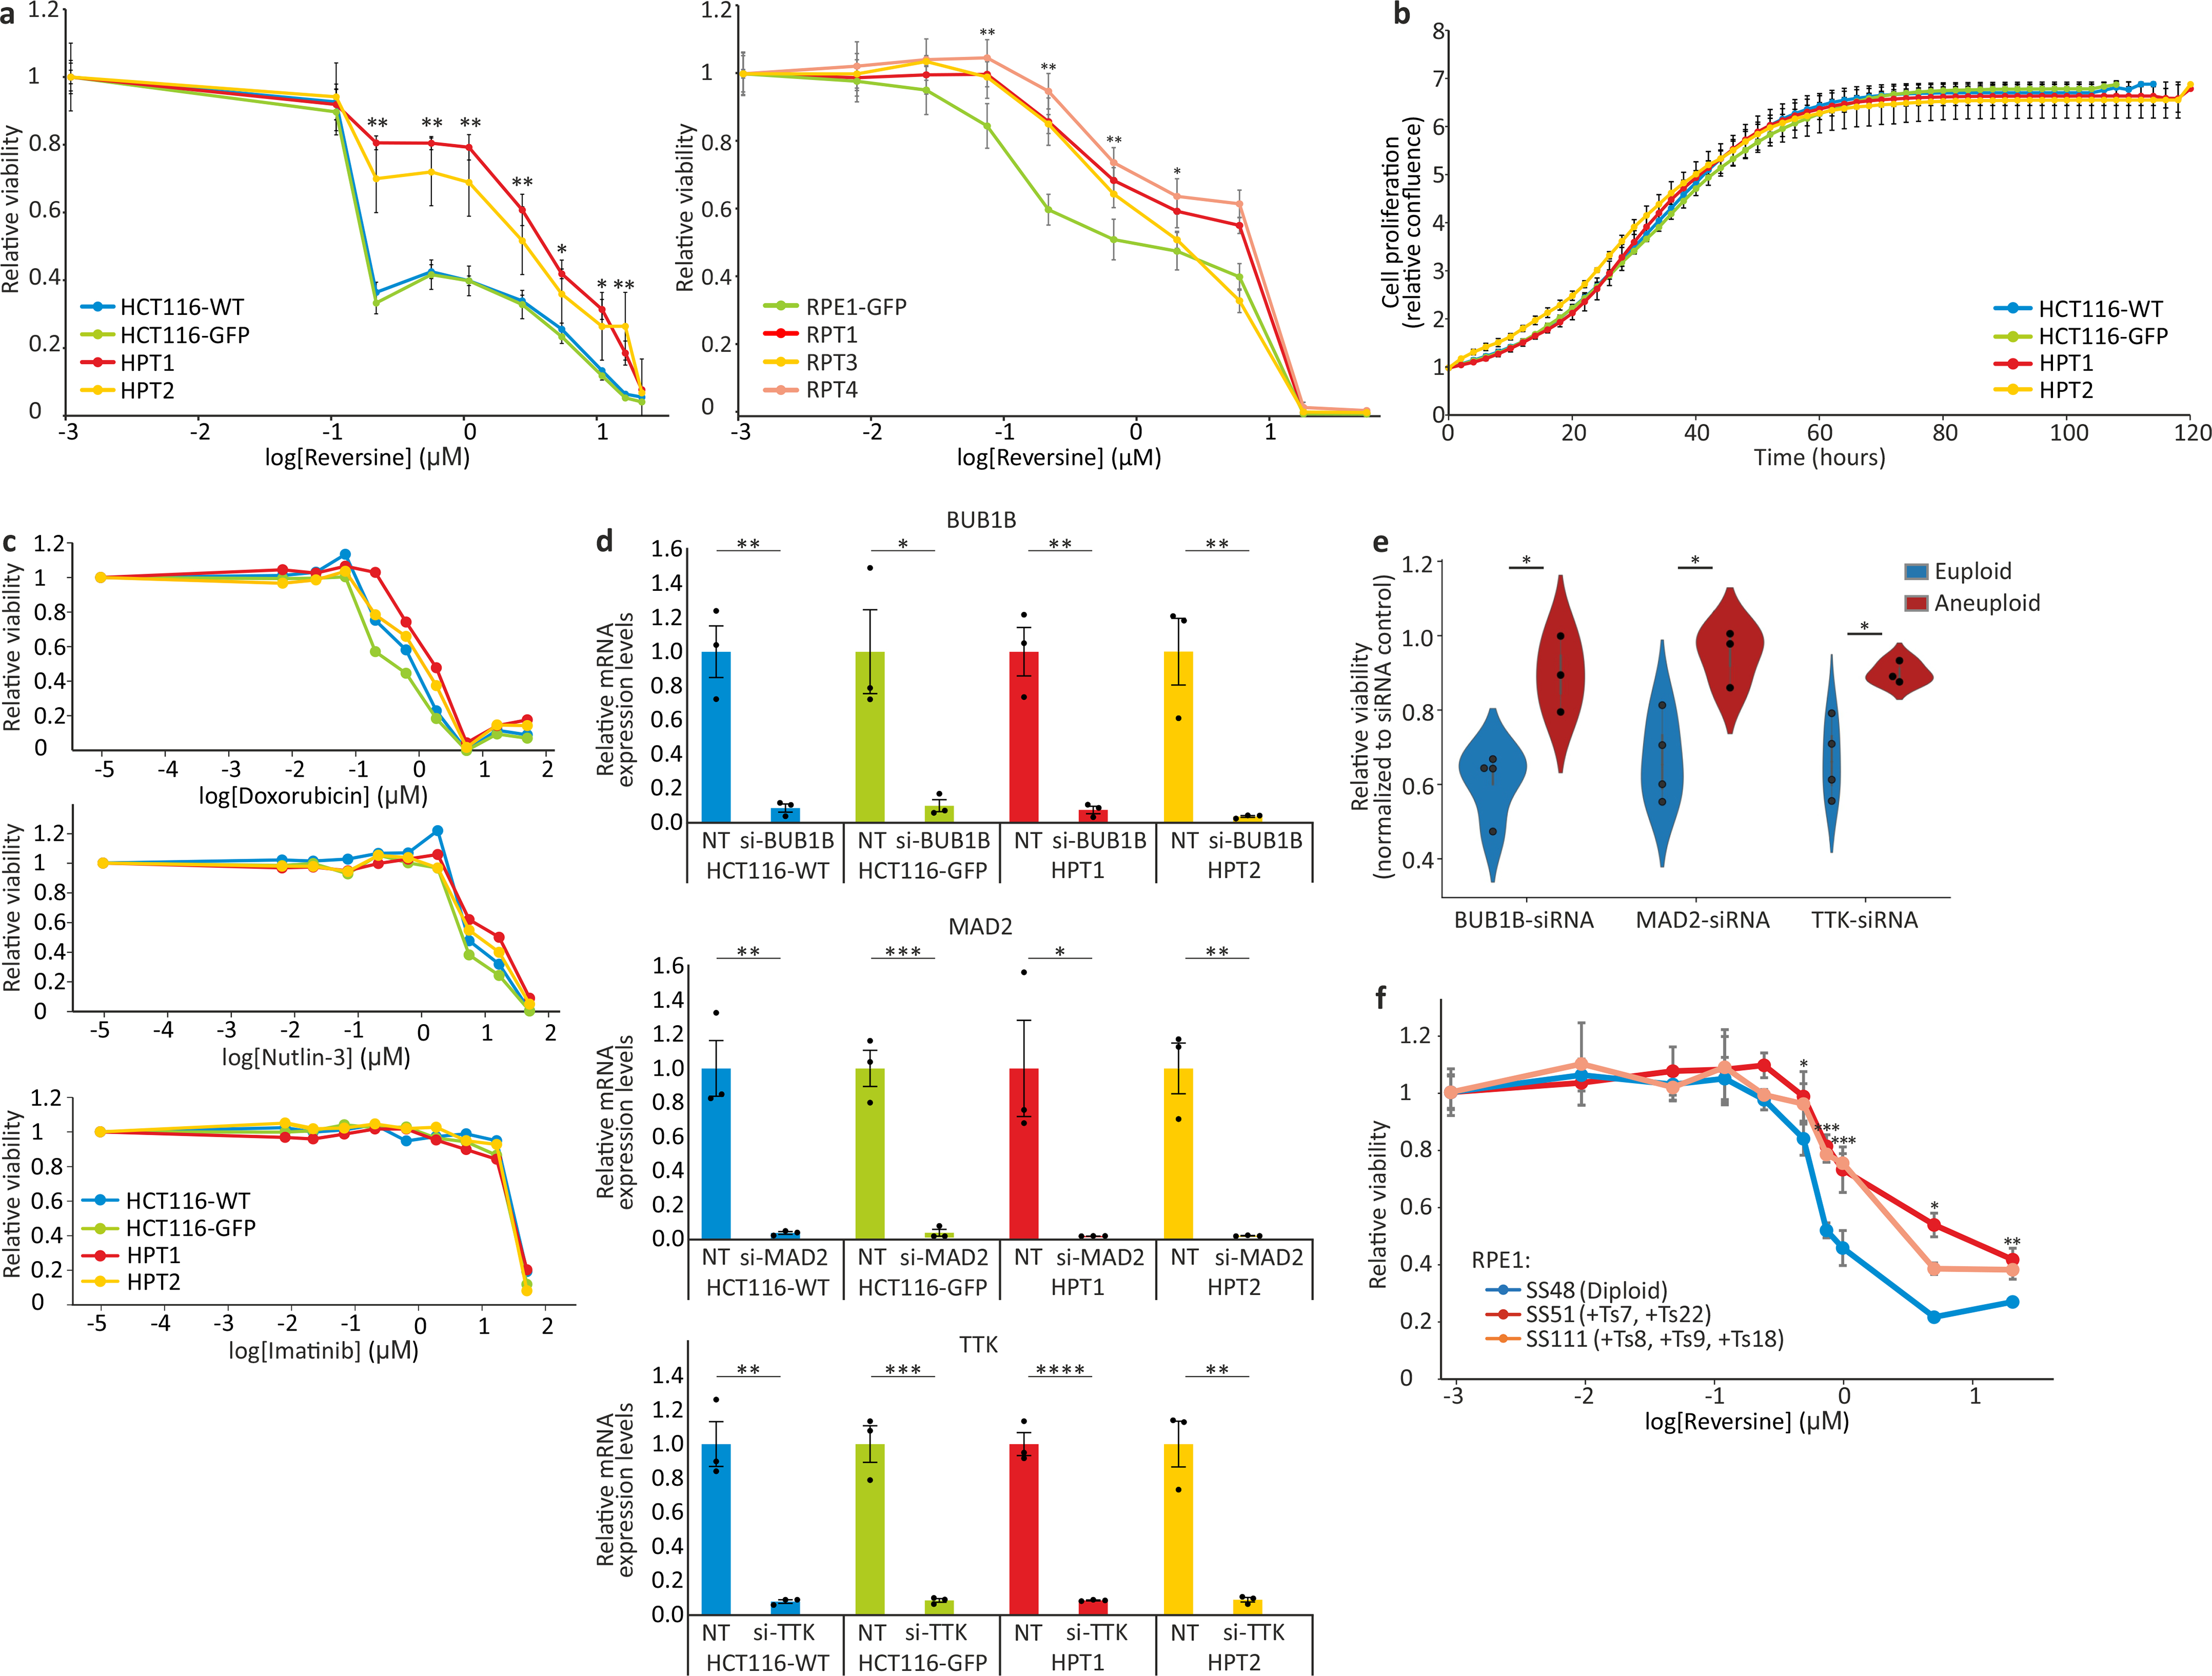
(a) Left: dose response curves of the response of near-diploid HCT116 cells and their highly-aneuploid derivatives HPT cells, to the SAC inhibitor reversine following 120hr of drug exposure. EC50 = 0.11μM, 0.11μM, 2.32μM and 1.06μM, for HCT116-WT, HCT116-GFP, HPT1 and HPT2, respectively. Right: dose response curves of the response of near-diploid RPE1 cells and their highly-aneuploid derivatives RPT cells, to the SAC inhibitor reversine following 120hr of drug exposure. EC50 = 0.13μM, 1.82μM, 0.57μM and 2.07μM, for RPE1-GFP, RPT1, RPT3 and RPT4, respectively. *, p<0.05; **, p<0.01; ***, p<0.001; two-tailed t-test. Data represent the mean ± s.d.; n=3 biological replicates. (b) Time-lapse imaging-based proliferation curves of HCT116 and HPT cells under standard culture conditions. Data represent the mean ± s.d.; n=3 biological replicates. (c) Dose response curves of the response of HCT116 and HPT cells to three drugs with unrelated mechanisms of action. Doxorubicin EC50 = 0.61μM, 0.32μM, 1.2μM and 0.89μM; Nutlin-3 EC50 = 11.88μM, 19.28μM, 15.26μM and 65.11μM; Imatinib EC50 = 17.94μM, 19.08μM, 18.77μM and 23.31μM; for HCT116-WT, HCT116-GFP, HPT1 and HPT2, respectively. (d) Relative mRNA expression levels of BUB1B, MAD2 and TTK, confirming successful siRNA-mediated knockdown of each gene in all cell lines. *, p=0.011, p=0.012 for HCT116-GFP and HPT1, respectively; **, p=0.0019, p=0.0015, p=0.0039 for BUB1B in HCT116-WT, HPT1 and HPT2, respectively; p=0.0021, p=0.0013 for MAD2 in HCT116-WT and HPT2, respectively; p=0.0011, p=0.0012 for TTK in HCT116-WT and HPT2, respectively; ***, p=0004, p=0.0005 for MAD2 and TTK in HCT116-GFP, respectively; ****, p=9e-05; one-tailed t-test; n=3 biological replicates. Data represent the mean ± s.e.m. (e) The relative viability of 4 near-diploid (CAL51, EN, MHHNB11, VMCUB1) and 3 highly-aneuploid (MDAMB468, PANC0813, SH0TA) cancer cell lines following 72hr of siRNA-mediated knockdown of 3 SAC components: BUB1B, MAD2 and TTK. Results are normalized to a non-targeting siRNA control. *, p=0.010, p=0.016, and p=0.015, for BUB1B, MAD2 and TTK, respectively; two-tailed t-test. Error bars, s.d. (f) Dose response curves of the response of the near-diploid RPE1 clone SS48 and its isogenic aneuploid clones SS51 (+Ts7, +Ts22) and SS111 (+Ts8, +Ts9, +Ts18), to the SAC inhibitor reversine following 120hr of drug exposure. EC50 = 0.66μM, 1.03μM and 1.03μM, for SS48, SS51 and SS111, respectively *, p<0.05; **, p<0.01; ***, p<0.001; two-tailed t-test. Data represent the mean ± s.d.; n=3 biological replicates.