
Extended Data Figure 8: Transcriptional and cellular characterization of SACi in aneuploid cells.
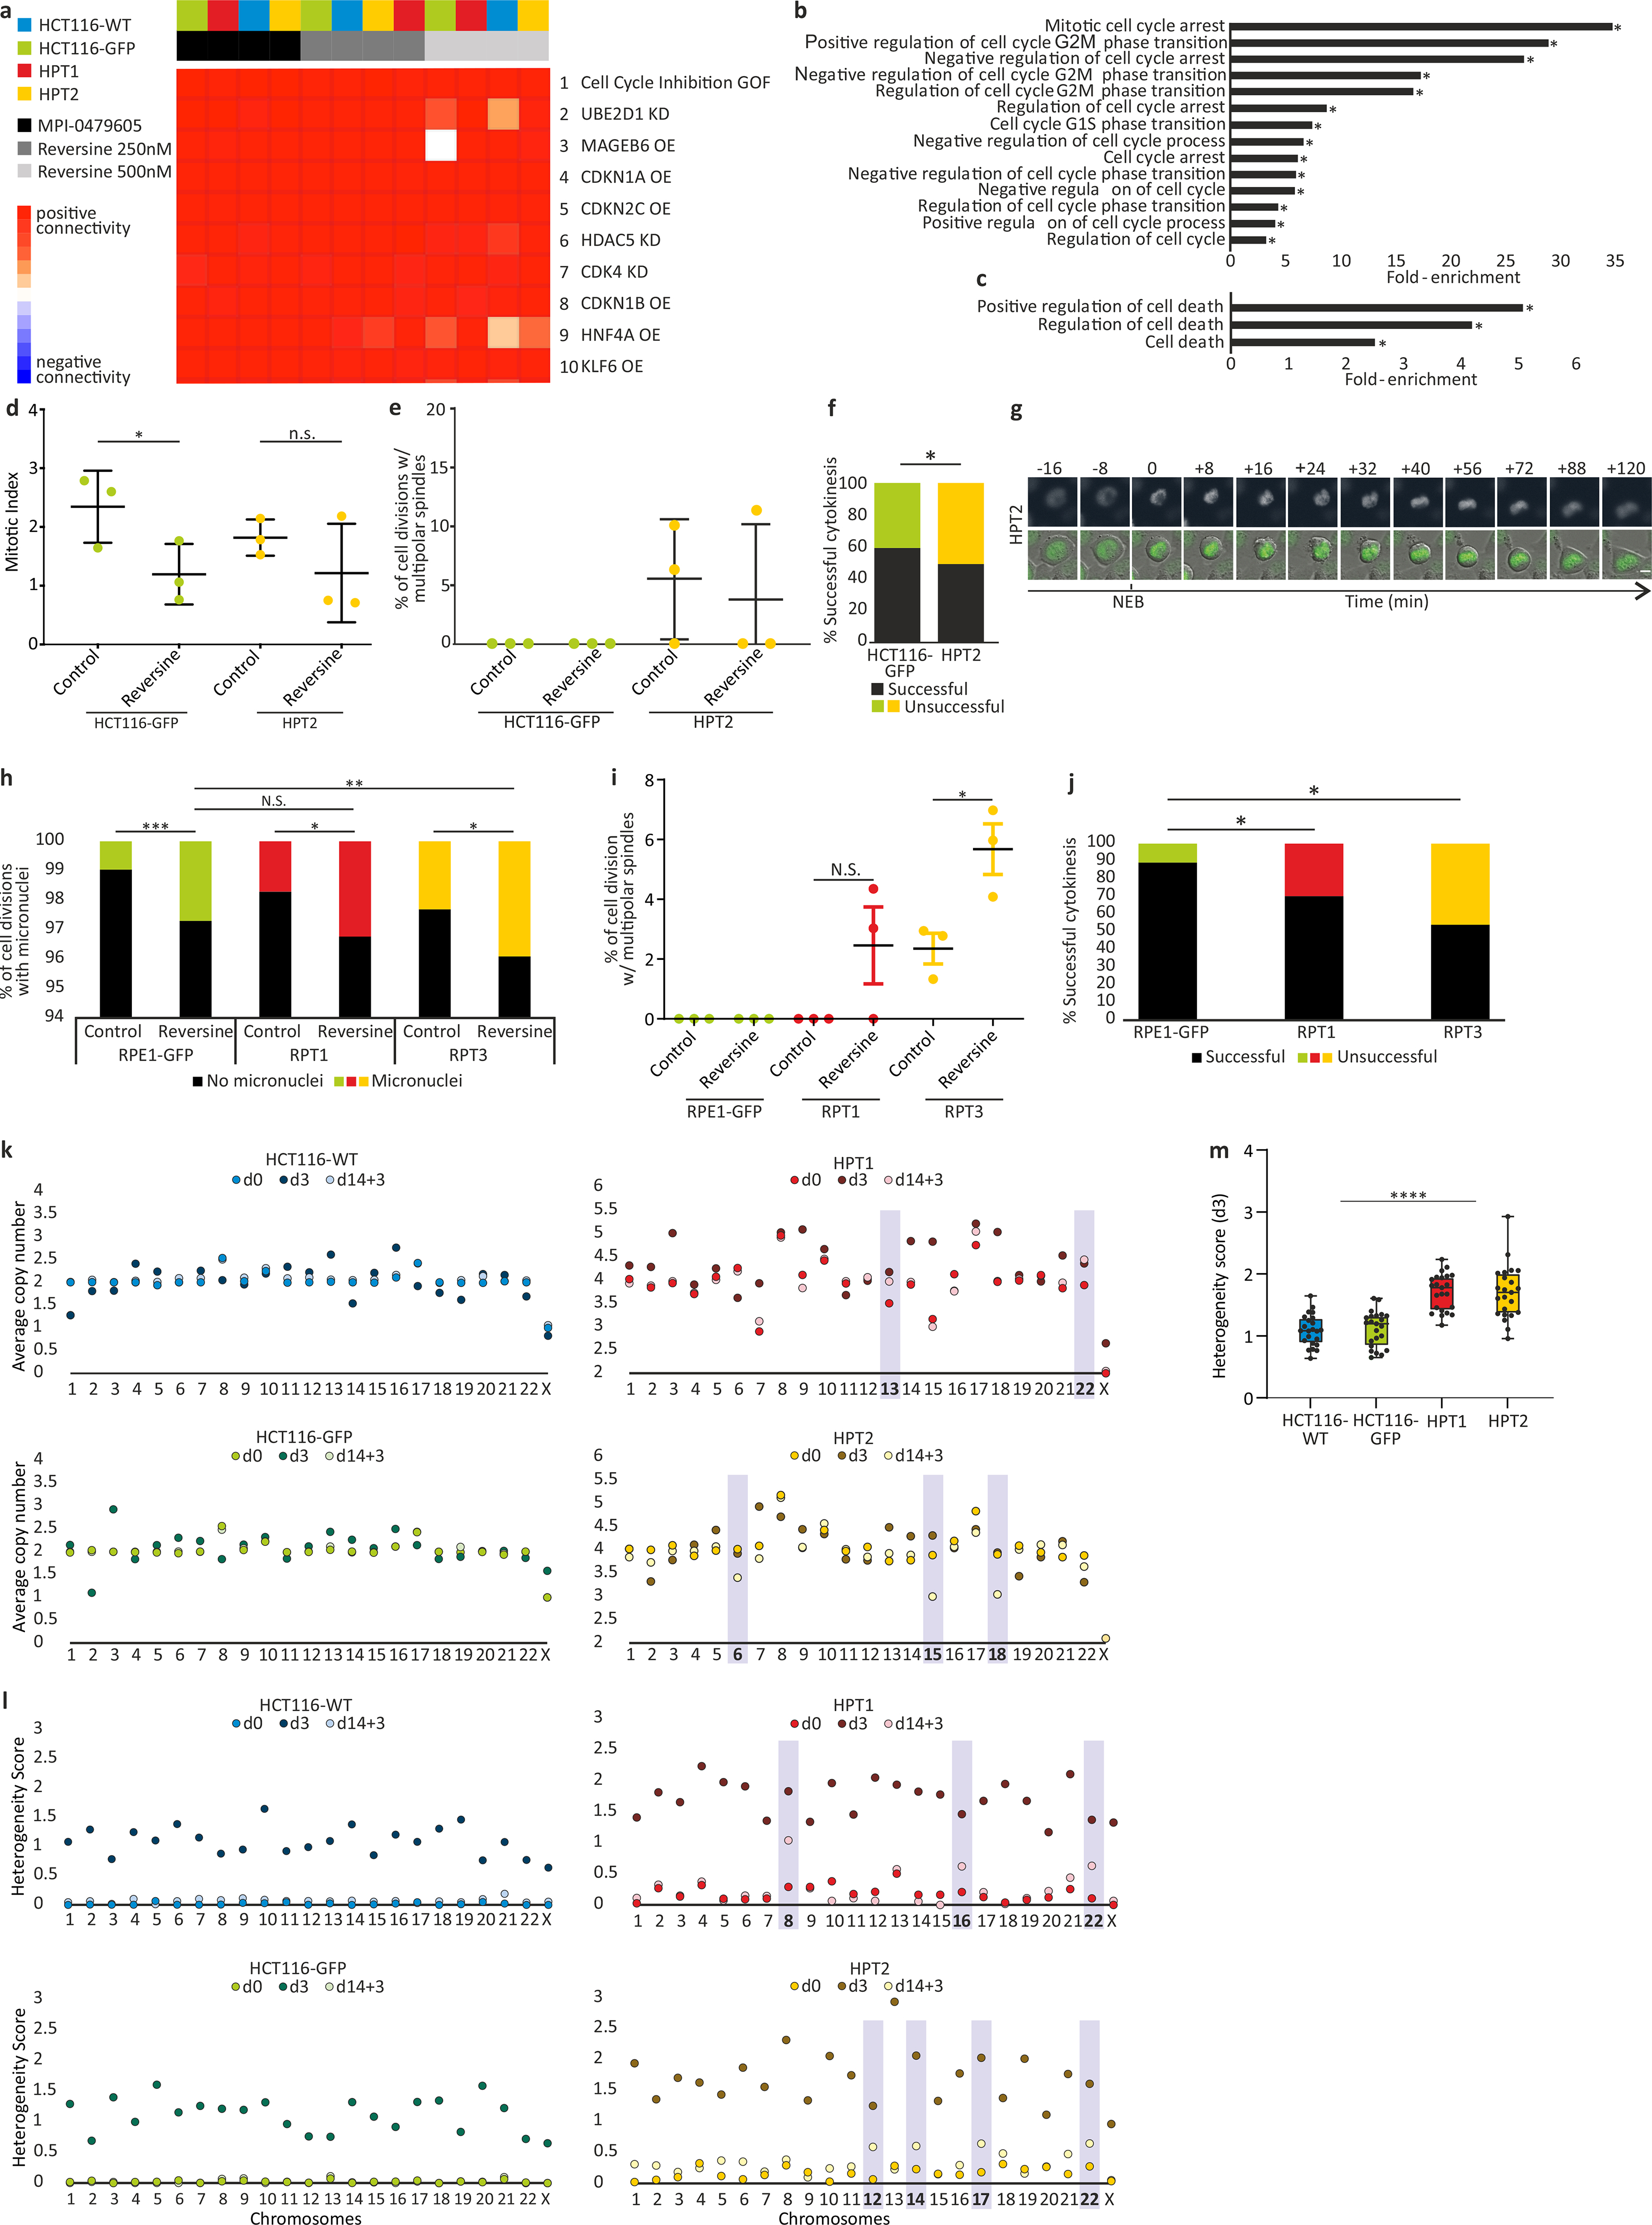
(a) The top 10 results of a Connectivity Map (CMap) query52 of the transcriptional response of HCT116 and HPT cells to the SAC inhibitors, reversine (250nM and 500nM) and MPI-0479605 (250nM). The top connection is “Cell cycle inhibition”, correctly identifying the expected mechanism of action of these compounds. GOF, gain of function; OE, over-expression; KD, knockdown. (b) Functional enrichment of gene sets related to cell cycle regulation. Shown are the gene sets that were significantly more affected by SACi in the highly-aneuploid HPT1 and HPT2 cells than in the nearly-diploid HCT116-WT and HCT116-GFP cells. *, p<0.05, one-tailed Fisher’s exact test. (c) Functional enrichment of gene sets related to cell death. Shown are the gene sets that were significantly more affected by SACi in the highly-aneuploid HPT1 and HPT2 cells than in the nearly-diploid HCT116-WT and HCT116-GFP cells. *, p<0.05, one-tailed Fisher’s exact test. (d) The mitotic index of HCT116 and HPT cells cultured under standard conditions or exposed to the SAC inhibitor reversine (500nM) for 24hr. *, p=0.035; n.s., p=0.17; two-tailed t-test; Error bars, s.d.; n=3 biological replicates. (e) Imaging-based quantification of the prevalence of cell divisions with multipolar spindles in HCT116 and HPT cell lines cultured under standard conditions or treated with reversine (500nM) for 24hr; n=3 biological replicates. Error bars, s.d. (f) The prevalence of premature mitotic exit (cytokinesis failure) in HCT116 and HPT cells exposed to the SAC inhibitor reversine (500nM) for 24hr. *, p=0.047; two-tailed Fisher’s exact test. (g) Representative images of premature mitotic exit in HPT2 cells exposed to reversine (500nM). T=0 defines nuclear envelope breakdown (NEB). Scale bar, 10μm. (h) The prevalence of micronuclei formation in RPE1 and RPT cells cultured under standard conditions or exposed to the SAC inhibitor reversine (500nM) for 24hr. n.s., p>0.05; *, p=0.013 and p=0.015 for the differences between the treated and untreated RPT1 and RPT3 cells, respectively; **, p=0.004; ***, p<0.0002; two-tailed t-test. (i) The prevalence of cell divisions with multipolar spindles in RPE1 and RPT cells cultured under standard conditions or exposed to the SAC inhibitor reversine (500nM) for 24hr. n.s., p>0.05; *, p=0.028; two-tailed t-test. Error bars, s.d. (j) The prevalence of premature mitotic exit (cytokinesis failure) in RPE1 and RPT cells exposed to the SAC inhibitor reversine (500nM) for 24hr. *, p=0.044 and p=0.019 for the comparisons between RPE1 and RPT1 or RPT3, respectively; two-tailed t-test. (k) Chromosomal copy number states of HCT116 and HPT cells at each of the 3 time points that were sequenced by scDNAseq. Differences between the pre-treated (d3) and post-treated (d14+3) populations are highlighted. (l) Chromosomal heterogeneity scores of the HCT116 and HPT cells at each of the 3 time points. Highly-heterogeneous chromosomes in the post-treated populations (d14+3) are highlighted; n=23 chromosomes. (m) Comparison of the chromosomal heterogeneity scores between the near-diploid HCT116 cells and the highly-aneuploid HPT cells. Bar, median; box, 25th and 75th percentile; whiskers, 1.5 X interquartile range; circles, individual chromosomes. ****, p=2e-09; two-tailed t-test.