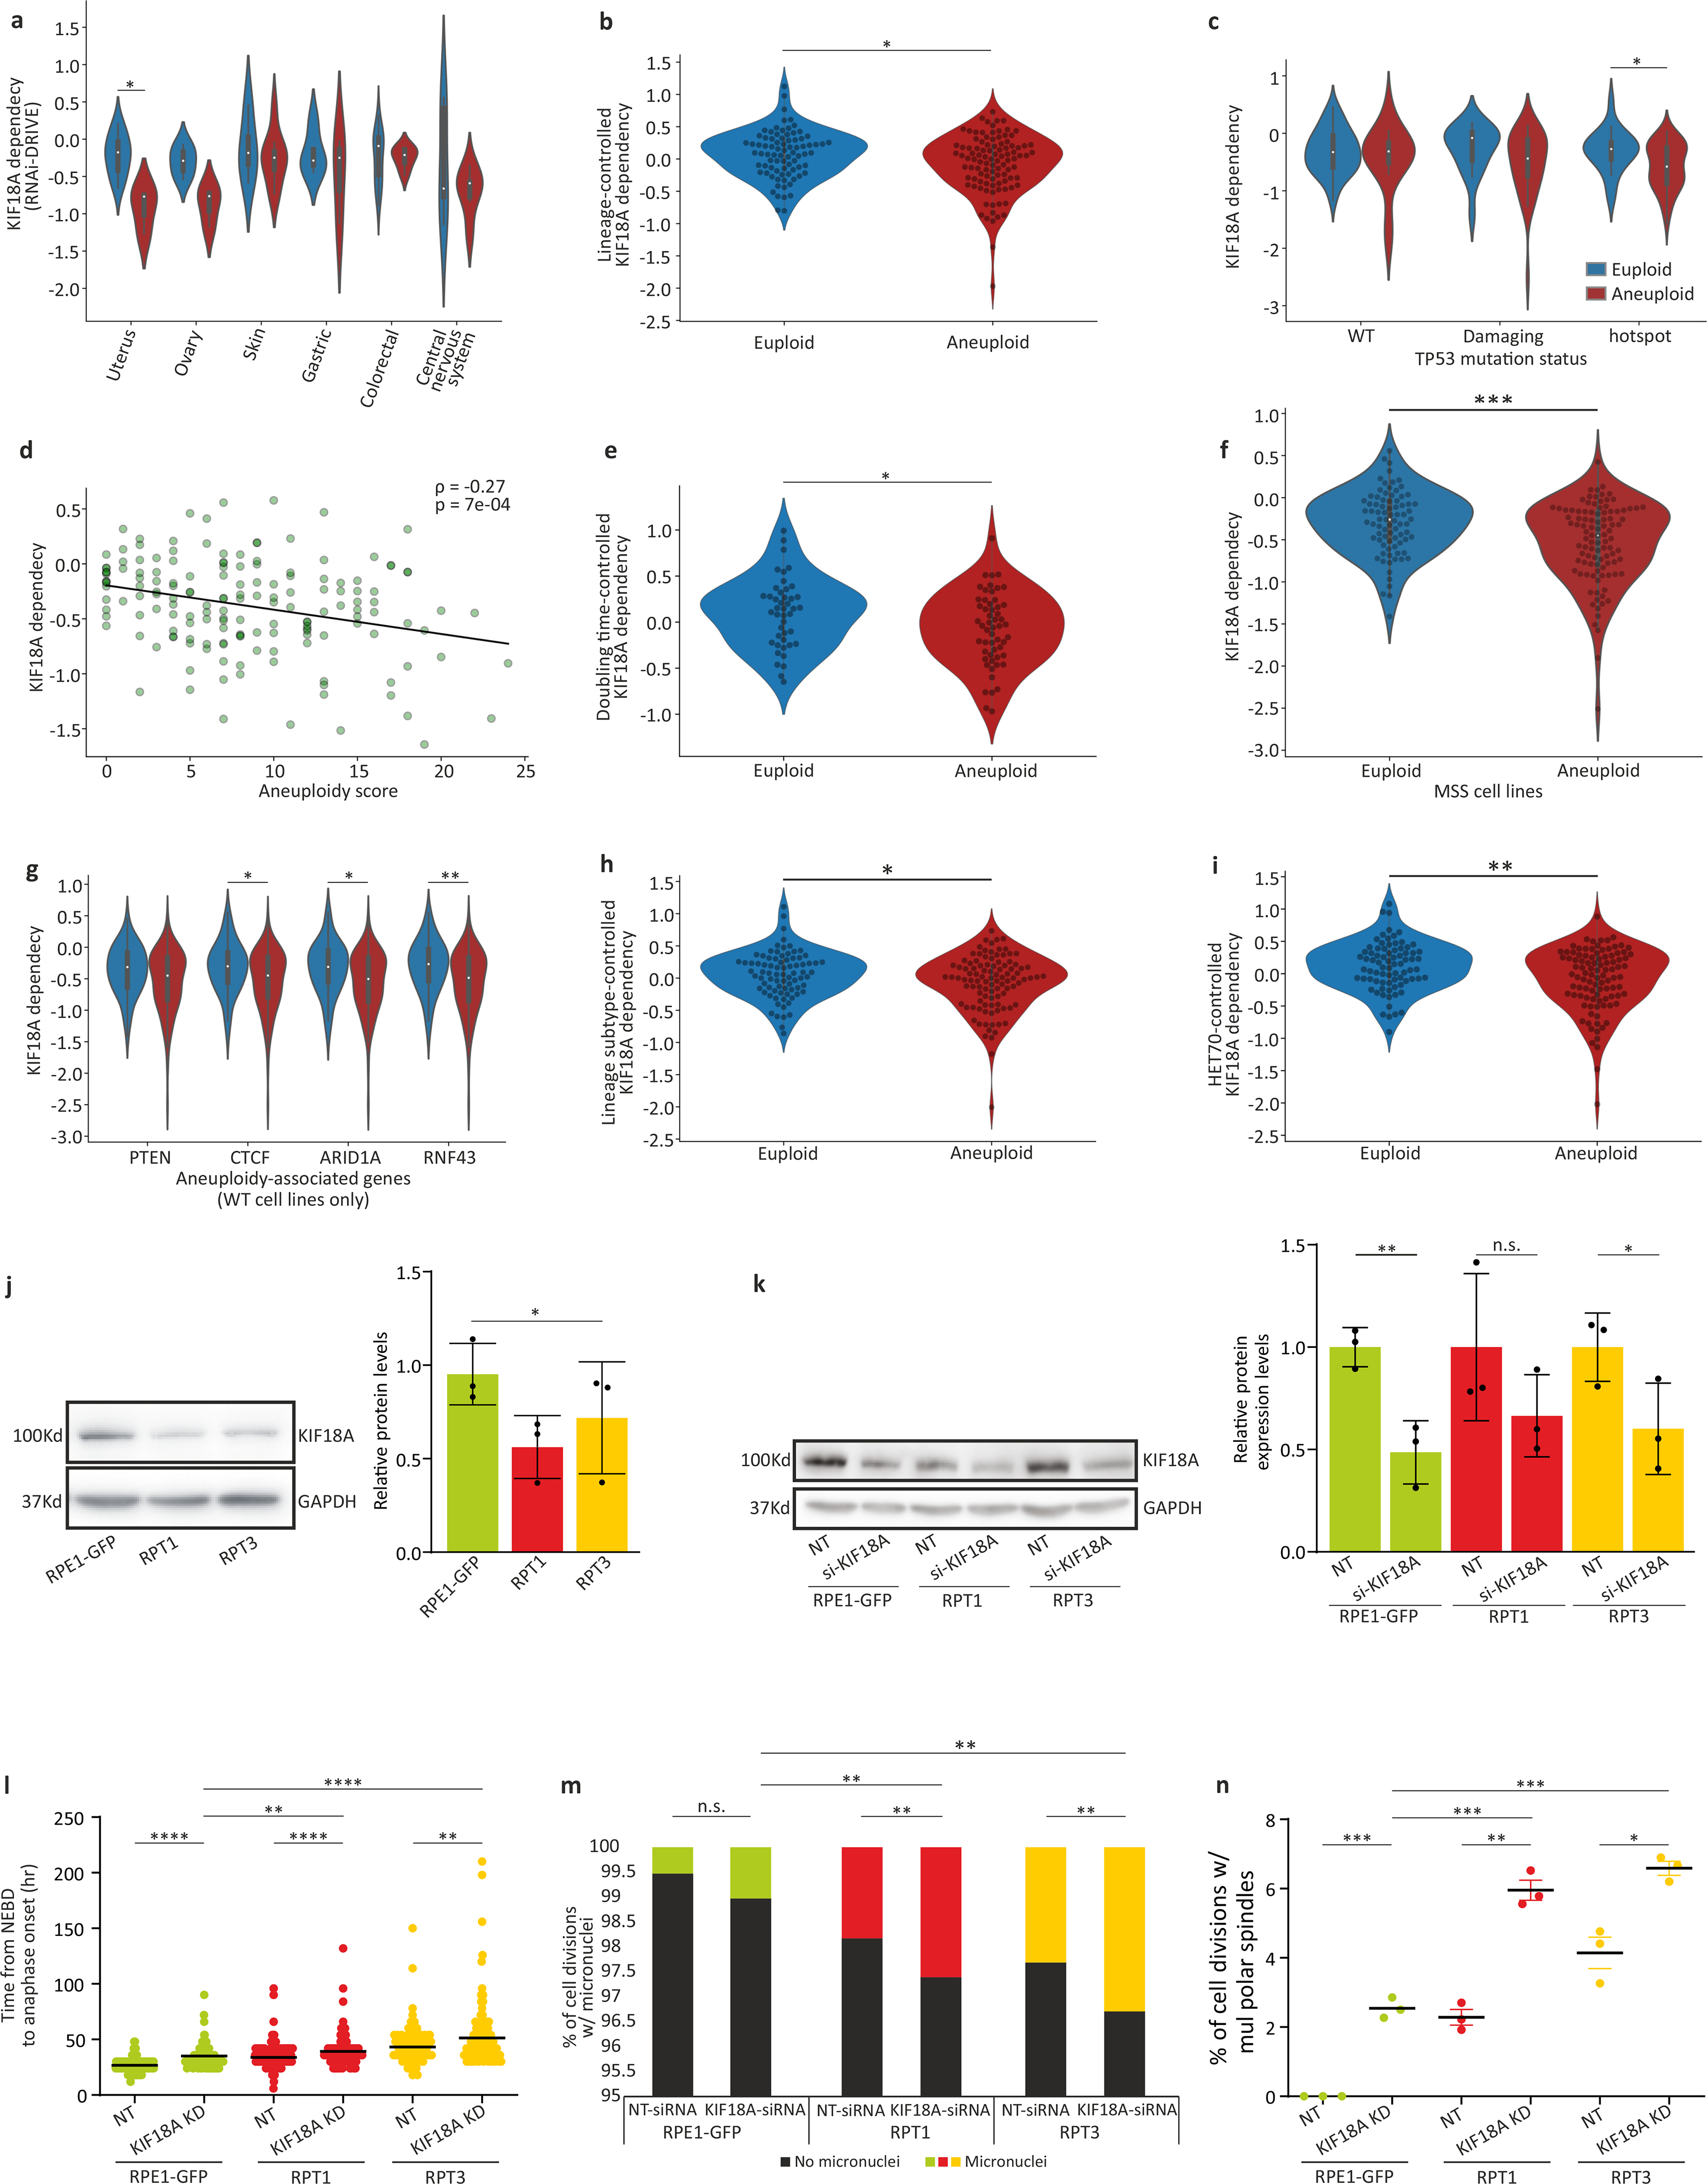
Extended Data Figure 10: Increased sensitivity of aneuploid cells to KIF18A inhibition.

(a) The sensitivity of near-euploid and highly-aneuploid cancer cell lines to the knockdown of KIF18A in the DRIVE RNAi screen across multiple cell lineages. *, p=0.022; two-tailed t-test. (b) The sensitivity of near-euploid and highly-aneuploid cancer cell lines to the knockdown of KIF18A in the DRIVE RNAi screen, after accounting for lineage-specific differences in gene dependency scores using linear regression. *, p=0.012; two-tailed t-test. (c) The sensitivity of near-euploid and highly-aneuploid cancer cell lines to the knockdown of KIF18A in the DRIVE RNAi screen, across TP53 mutation classes. *, p=0.026; two-tailed t-test. (d) The correlations between AS and the dependency on KIF18A in the DRIVE RNAi screen, for cell lines that have not undergone whole-genome duplication (i.e., cell lines with basal ploidy of n=2). Spearman’s ρ = −0.27 (p=7e-04). (e) The sensitivity of near-euploid and highly-aneuploid cancer cell lines to the knockdown of KIF18A in the DRIVE RNAi screen, after removing the effect of doubling time on gene dependency scores using linear regression. *, p=0.022; two-tailed t-test. (f) The sensitivity of near-euploid and highly-aneuploid cancer cell lines without microsatellite instability (MSS lines only) to the knockdown of KIF18A in the DRIVE RNAi screen. ***, p=3e-04; two-tailed t-test. (g) The sensitivity of near-euploid and highly-aneuploid cancer cell lines to the knockdown of KIF18A in the DRIVE RNAi screen, in cell lines that are WT for the 4 genes most selectively mutated in aneuploid human tumors (after TP53)12. *, p=0.021 and p=0.02, for CTCF and ARID1A, respectively; **, p=0.004; two-tailed t-test. (h) The sensitivity of near-euploid and highly-aneuploid cancer cell lines to the knockdown of KIF18A in the DRIVE RNAi screen, after removing the effect of lineage subtype on gene dependency scores using linear regression. *, p=0.024; two-tailed t-test. (i) The sensitivity of near-euploid and highly-aneuploid cancer cell lines to the knockdown of KIF18A in the DRIVE RNAi screen, after removing the effect of HET70 scores on gene dependency scores using linear regression. **, p=0.003; two-tailed t-test. (j) Left: Western blot of KIF18A protein expression levels in RPE1 and RPT cell lines. Right: Quantification of KIF18A expression levels (normalized to GAPDH). *, p-0.023; one-tailed t-test. Data represent the mean ± s.d.; n=3 biological replicates. (k) Relative protein expression levels of KIF18A, confirming successful KIF18 knockdown in the RPE1 and RPT cell lines 72hr post-transfection. Left: Western blot of KIF18A protein expression levels in RPE1, RPT1 and RPT3 before and after siRNA-mediated KIF18A knockdown. Right: Quantification of KIF18A expression levels (normalized to α-Tubulin). *, p=0.034, **,p=0.004; one-tailed t-test. Data represent the mean ± s.d.; n=3 biological replicates. (l) Time-lapse imaging-based quantification of the time from nuclear envelope breakdown (NEBD) to anaphase onset in RPE1 and RPT cell lines exposed to non-targeting or KIF18A-targeting siRNAs for 72hr. **, p<0.01; ****, p<1e-04; two-tailed t-test. (m) The prevalence of micronuclei formation in HCT116 and HPT cells exposed to non-targeting or KIF18A-targeting siRNAs for 72hr. n.s., p>0.05; **, p<0.01; ***, p<0.001; two-tailed Fisher’s exact test. (n) Imaging-based quantification of the prevalence of cell divisions with multipolar spindles in HCT116 and HPT cell lines treated with non-targeting control or KIF18A-targeting siRNAs for 72hr. *, p<0.05; **, p<0.01; ***, p<0.001; two-tailed t-test; Error bars, s.d.; n=3 biological replicates.
