
Extended Data Figure 4: Reduced sensitivity of aneuploid cancer cells to chemical inhibition of the spindle assembly checkpoint.
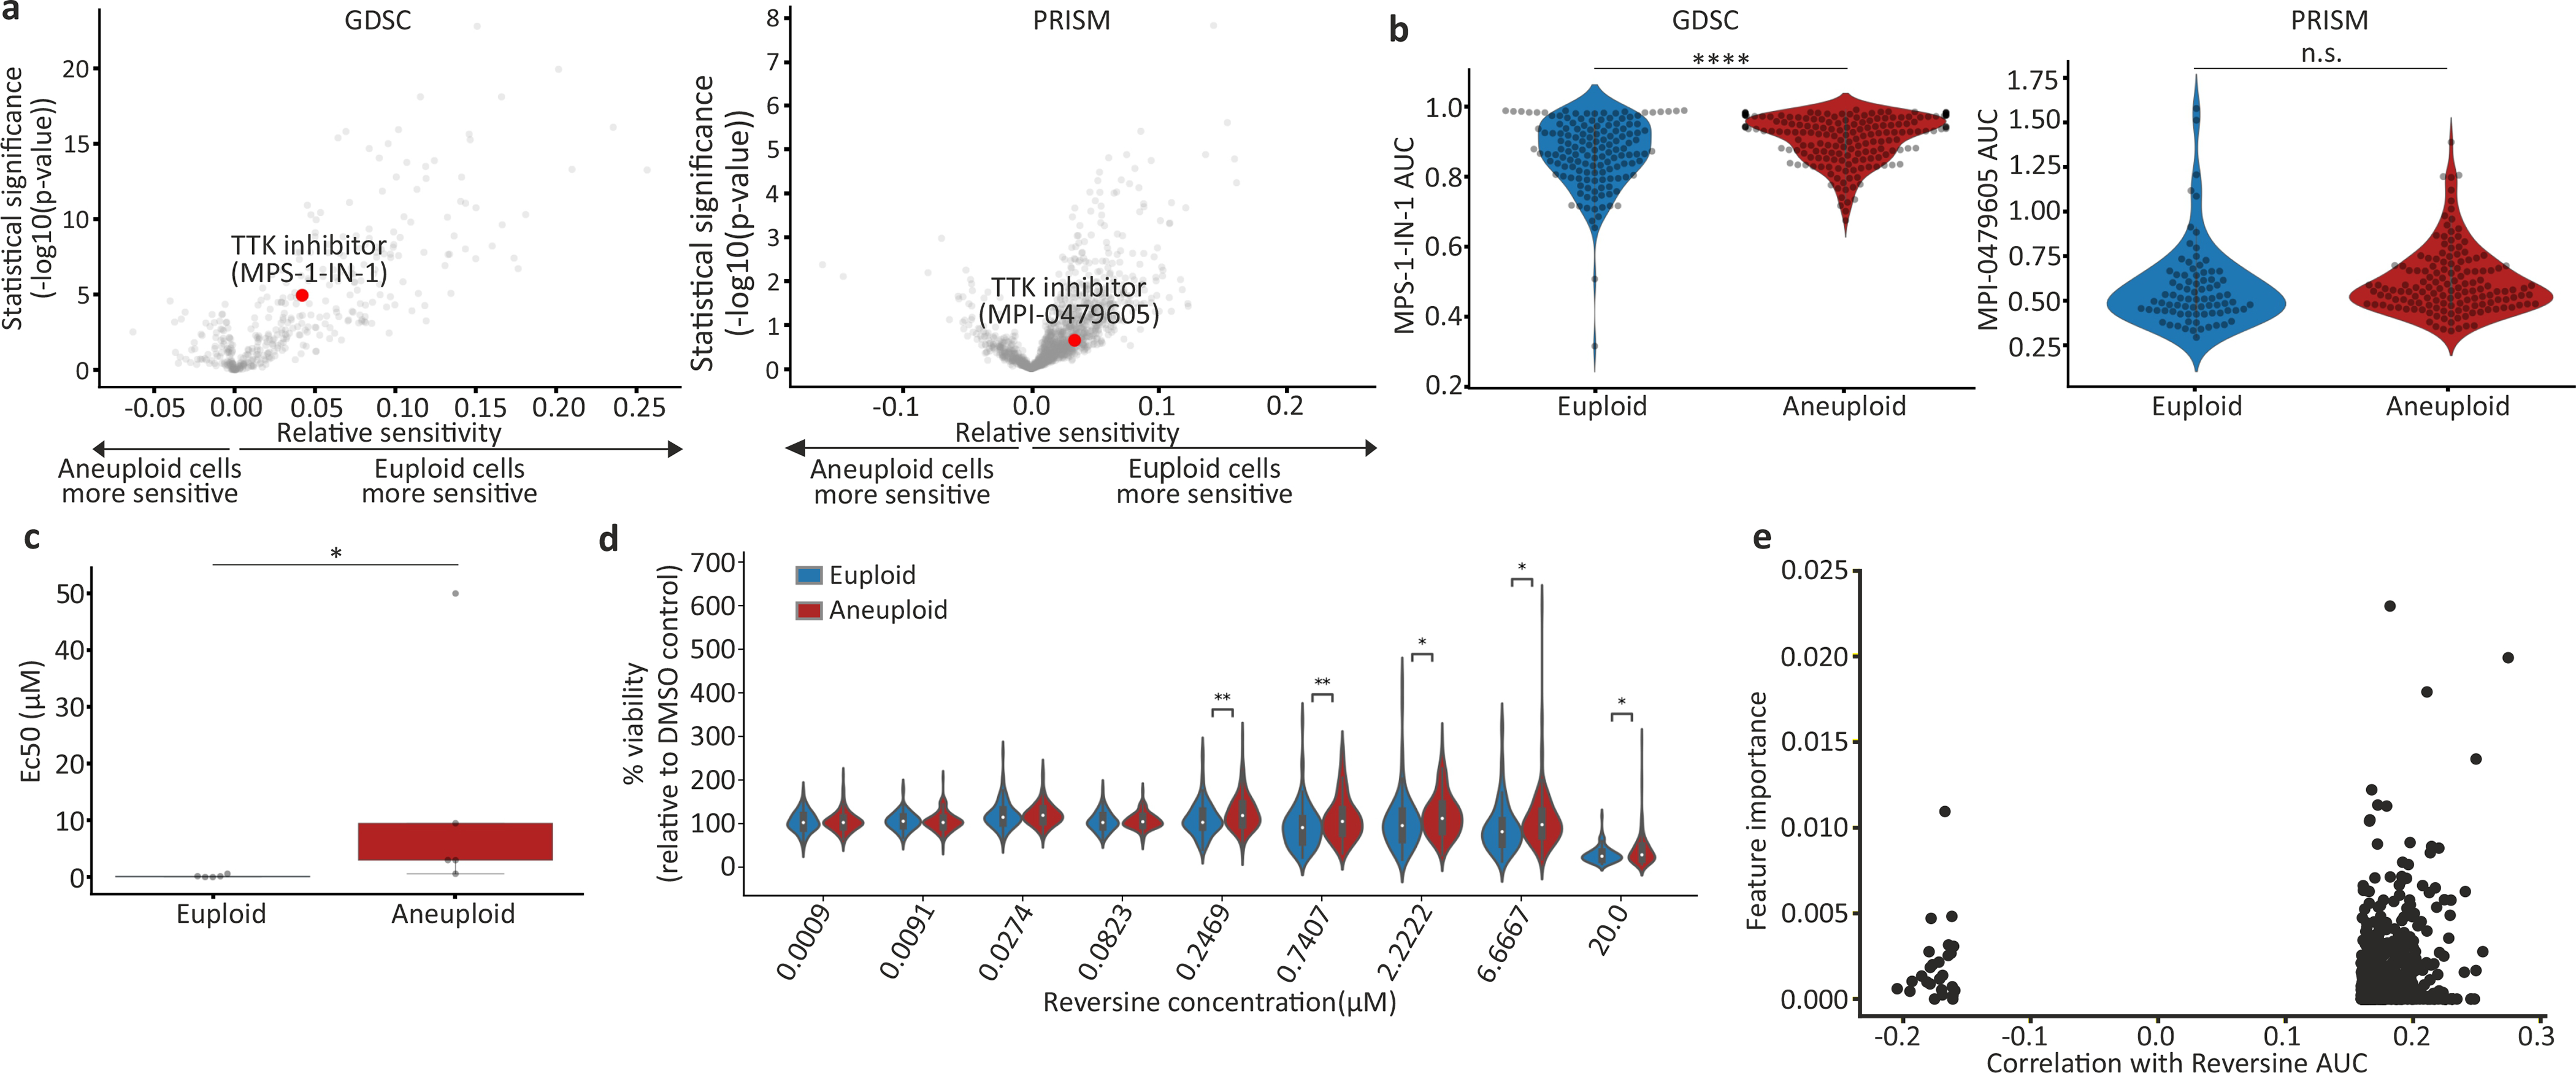
(a) Volcano plots showing the differential drug sensitivities between the near-euploid and highly-aneuploid cancer cell lines, based on the large-scale GDSC6 and PRISM screens9. MPS1-IN-1 and MPI-0479605, the only SAC inhibitors included in each screen, respectively, are highlighted in red. (b) The sensitivity of near-euploid and highly-aneuploid cancer cell lines to the SAC inhibitors MPS1-IN-1 and MPI-0479605 in the GDSC (left) and PRISM (right) screens. ****, p=1e-0.5; n.s., p=0.23; two-tailed t-test. (c) Experimental validation of the response of 5 near-euploid (CAL51, EN, MHHNB11, SW48 and VMCUB1) and 5 highly-aneuploid (MDAMB468, NCIH1693, PANC0813, SH10TC and A101D) cell lines to 72hr exposure to the SAC inhibitor reversine. *, p=0.016, two-tailed Wilcoxon rank-sum test; n=5 cell lines in each group. Bar, median; box, 25th and 75th percentile; whiskers, 1.5 X interquartile range. (d) Comparison of the sensitivity to reversine between near-euploid and highly-aneuploid cancer cell lines subjected to the PRISM cell viability assay, confirming the reduced sensitivity of highly-aneuploid cells to a 120hr exposure to SAC inhibitors. n.s., p>0.05; *, p<0.05; **, p<0.01; two-tailed t-test. (e) An association analysis failed to identify a genomic biomarker of reversine sensitivity. Shown are the top 1000 genomic features identified by our model (see Methods). No feature stands out in terms of importance and/or correlation, and the overall predictive value is poor.