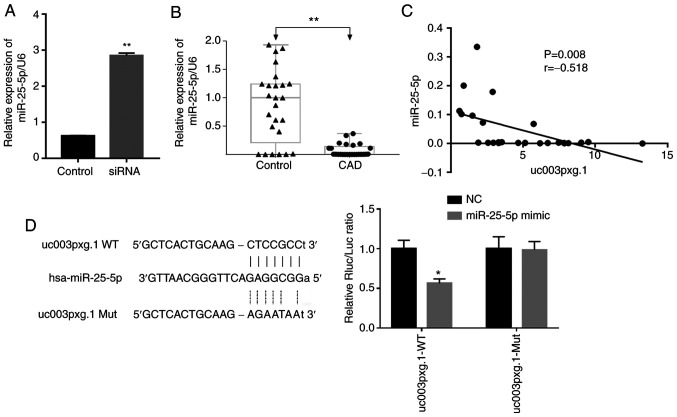
Figure 5.
Correlation between miR-25-5p and uc003pxg.1 expression levels. (A) Relative expression levels of miR-25-5p in HUVECs in the siRNA and control groups. **P<0.01 vs. control. (B) Expression levels of miR-25-5p in peripheral blood mononucleated cells from patients with CAD and controls (n=25). **P<0.01. (C) uc003pxg.1 expression levels were negatively correlated with those of miR-25-5p in patients with CAD. (D) Luciferase activities were determined in the miR-25-5p mimic + uc003pxg.1-wt and miR-25-5p mimic + uc003pxg.1-mut groups. *P<0.05 vs. NC. miR, microRNA; HUVECs, human umbilical vein endothelial cells; control, mimic-NC; siRNA, small interfering RNA targeting uc003pxg.1; CAD, coronary artery disease; wt, wild-type; mut, mutant.

