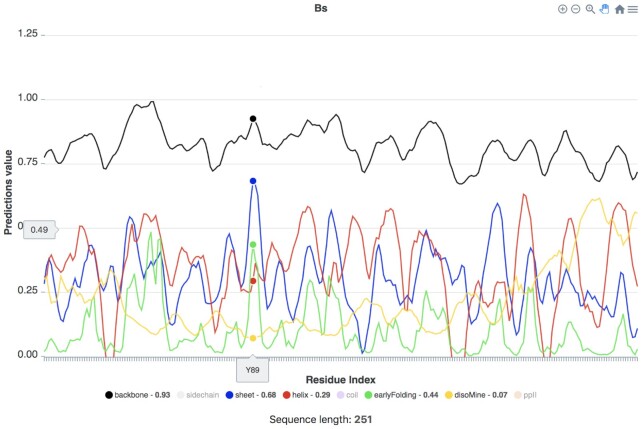
Figure 2.
Single sequence predictions for the Bs protein as displayed in the server, showing the Dynamine backbone dynamics (black), sheet (blue) and helix (red) propensities, and the early folding (green) and disorder predictions (yellow). The prediction values for the amino acid residue (here Y89) corresponding to the cursor position (large dots) are shown next to their name in the legend at the bottom.

