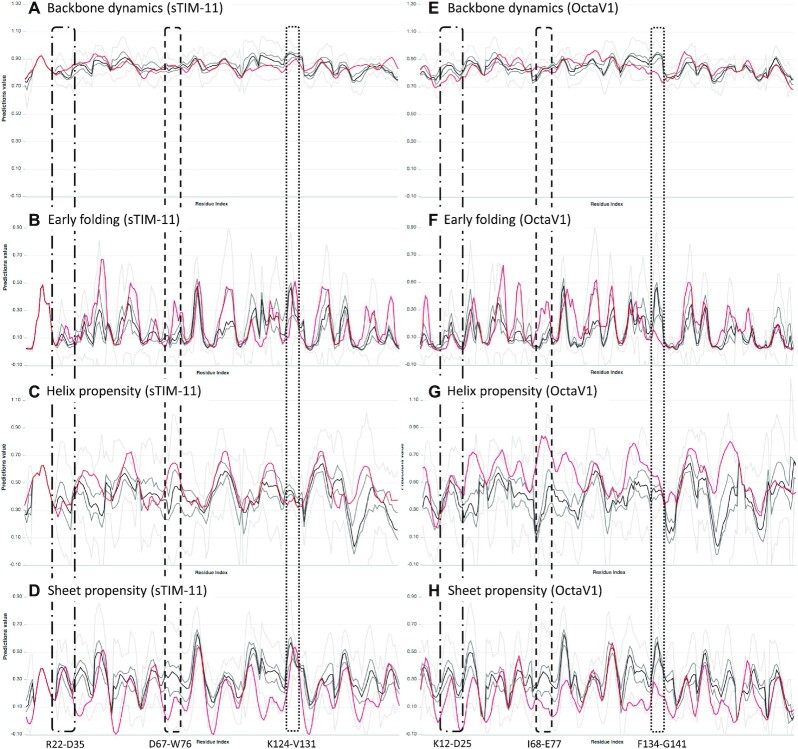
Figure 3.
Multiple sequence alignment statistics for the sTIM-11 (left column) and OctaV1 (right column) proteins for backbone dynamics (A, E), early folding (B, F) and helix (C, G) and sheet propensity (D,H). The regions corresponding to Arg22–Asp35 (sTIM-11) and Lys12–Asp25 (OctaV1) (dash-dot box), Asp67–Trp76 (sTIM-11) and Ile68–Glu77 (OctaV1) (dashed box) and Lys124–Val131 (sTIM-11) and Phe134–Gly141 (OctaV1) (dotted box) are indicated. The red lines show the actual sTIM-11 (left) and OctaV1 (right) predictions, the black line the median, the dark grey lines first/third quartile, and light grey the outlier range for the predicted values for the corresponding position in the MSA. Individual images were created from the ‘Download png’ plot feature.

