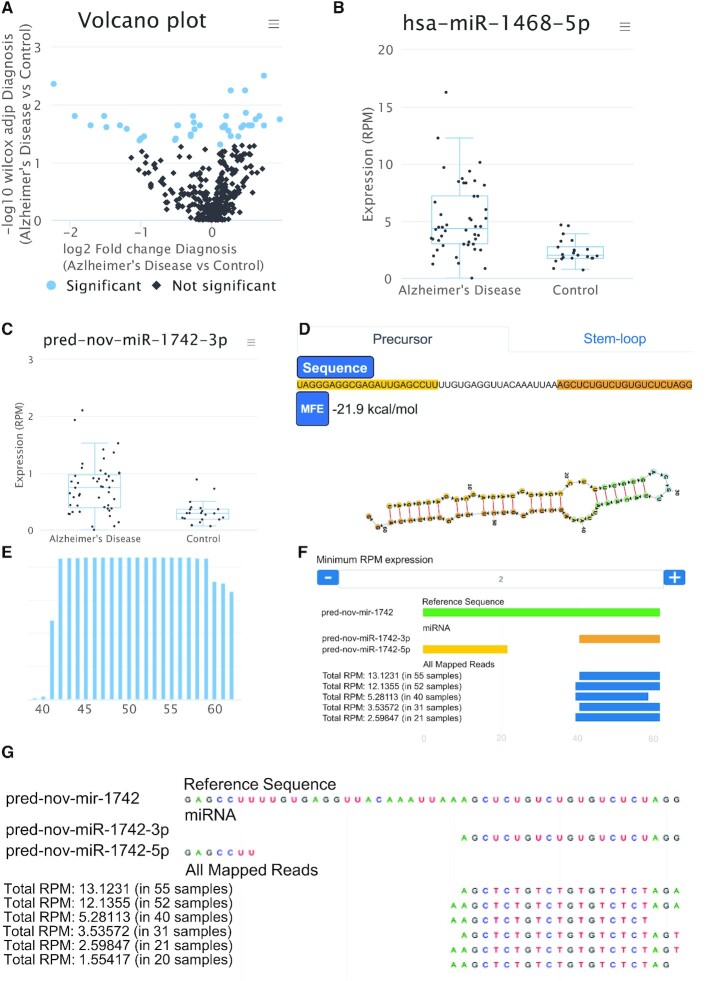
Figure 3.
Downstream analyses for AD and control samples. (A) Volcano plot displaying each microRNA as a dot. Colored dots are statistically significant (adjusted P-value < 0.05). (B) For one significant marker (hsa-miR-1468–5p) the data are presented as boxplots. Again, single samples can be highlighted by moving the mouse over. (C) Box-plot for a novel miRNA candidate. (D) Precursor structure of this novel miRNA candidate and the minimum free energy. Users can switch between the representation of the precursor and the stem-loop. (E) Distribution of reads on the mature -3p miRNA of the same candidate precursor. Towards the end of the mature miRNA, the –3p heterogeneity that is typical for miRNAs can be recognized. (F) Representation of isoforms. The green bar denotes the precursor, the yellow bar the –5p mature form, the orange bar the –3p form. Each blue bar shows an isoform. The number of reads supporting the isoform can be dynamically adjusted by the user (here, at least 2 RPM are required). (G) If users zoom in the representation, the single base resolution per isoform is displayed (in this example, 1 RPM coverage is sufficient).

