
Figure 3.
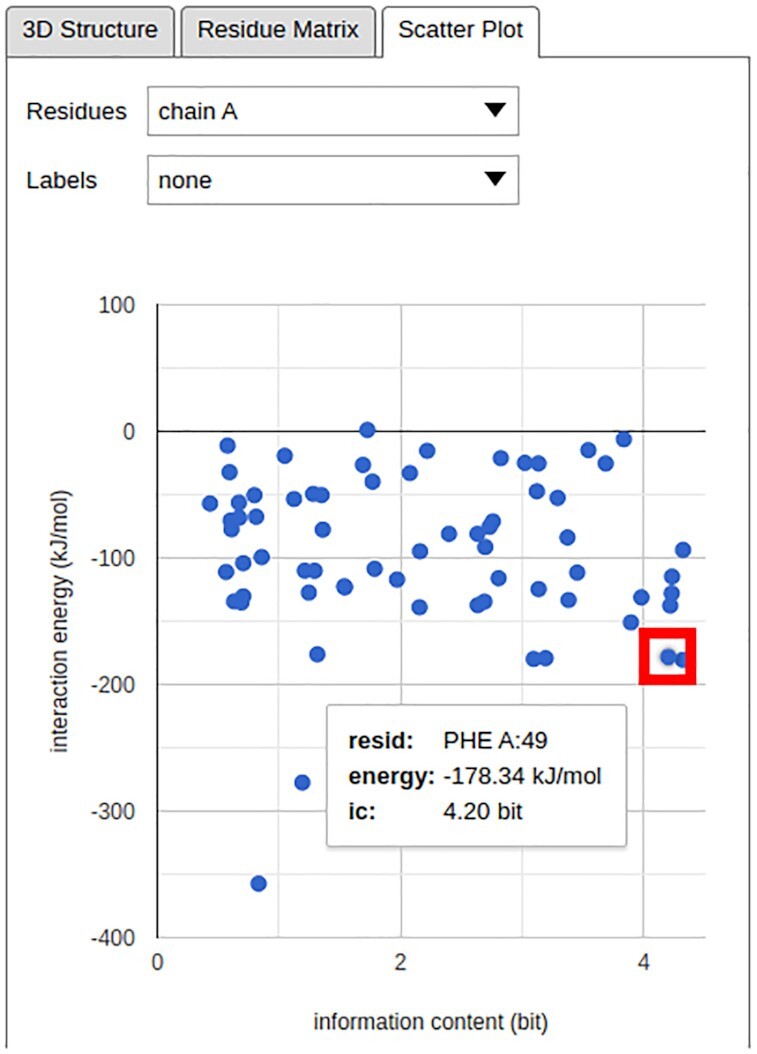
The total IE–IC value relations for the residues in the structure investigated in Figure 1. The single chain in the investigated structure has been selected using the Residues drop-down menu; the Labels drop-down menu can be used to add textual identifiers to individual points in the plot. In this example, the position of Phe49 in the scatter plot has been highlighted in a red rectangle, and its total IE and IC value are shown.