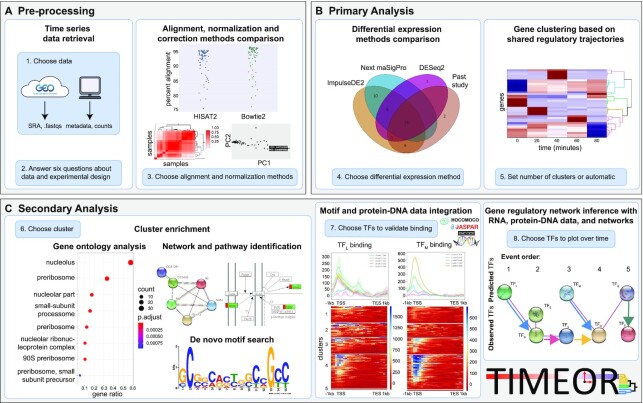
Figure 1.
TIMEOR enables users to interrogate and reconstruct gene regulatory networks. Blue boxes denote main user-guided stages. (A) Users specify a time-series RNA-seq data set in the Pre-process Stage in which the data are automatically retrieved, normalized, corrected, filtered and aligned to the selected organism reference genome using multiple alignment methods for comparison. Importantly, users may also input the count matrix directly, skipping to normalization and correction in step 3 of stage A. (B) The resulting count matrix is passed to Primary Analysis where multiple differential expression (DE) methods are run to produce a time-series clustermap of gene DE trajectories over time. (C) DE results are passed to Secondary Analysis for gene ontology, pathway, network, motif, protein–DNA binding data analysis, and gene regulatory network reconstruction. TF: transcription factor.

