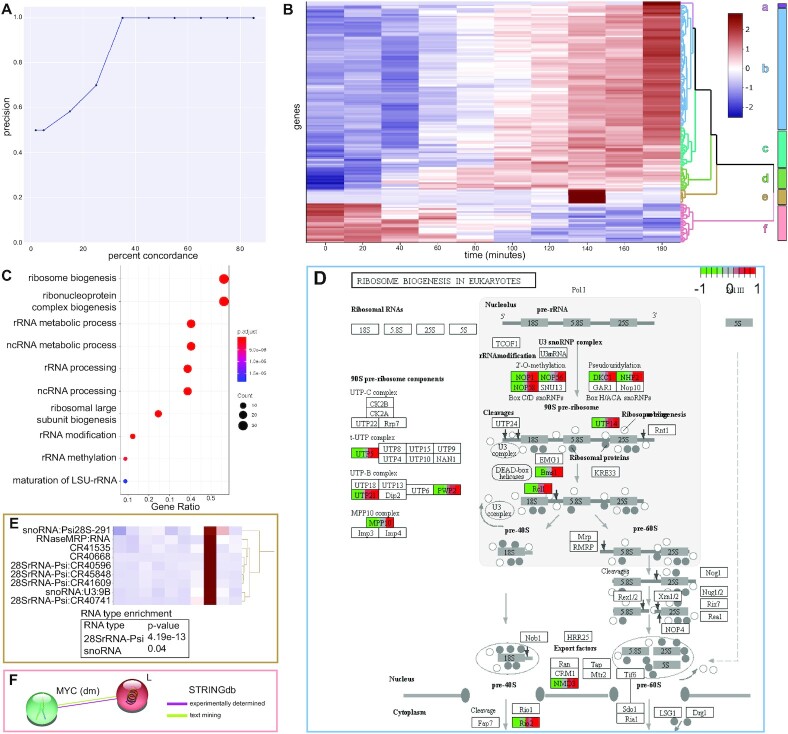
Figure 3.
TIMEOR accurately recovers known and novel mechanisms and genomic relationships. (A) Precision by percent concordance curve of TIMEOR’s ability to recover a simulated Homo sapiens TF GRN where the percent concordance between TF prediction methods ranges from 2 to 85%. (B) TIMEOR’s clustermap (25) of significant genes’ trajectories using z-score to denote change in downregulation (blue) and upregulation (red). (C) Without clustering, we recapitulate previous findings (26) and illustrate through GO analysis. Note TIMEOR uses Benjamini–Hochberg adjusted p-value correction. (D) TIMEOR’s pathway analysis for largest cluster b, which identifies the same ribosome biogenesis pathway as Zirin et al. (26). (E) TIMEOR highlights cluster e snoRNA pseudogenes and 28SrRNA pseudogenes which are enriched (hypergeometric test). (F) TIMEOR identified Lobe, which interacts directly with MYC (47). This interaction was not identified by prior analysis even though MYC was the focus of the previous study (26).

