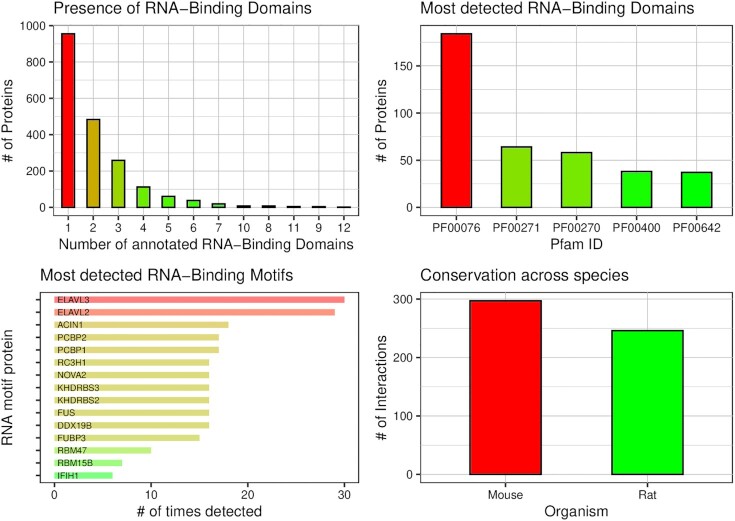
Figure 1.
Summary displayed in the main output page. Top-left: number of proteins having one or more RNA-binding domains (RBDs). Top-right: number of proteins in which the most detected RBDs were found. Bottom-left: number of RNA-binding motifs occurrences found in the analysed transcripts; only the most represented RBPs are displayed. Bottom-right: number of interactions predicted to be conserved in other organisms.

