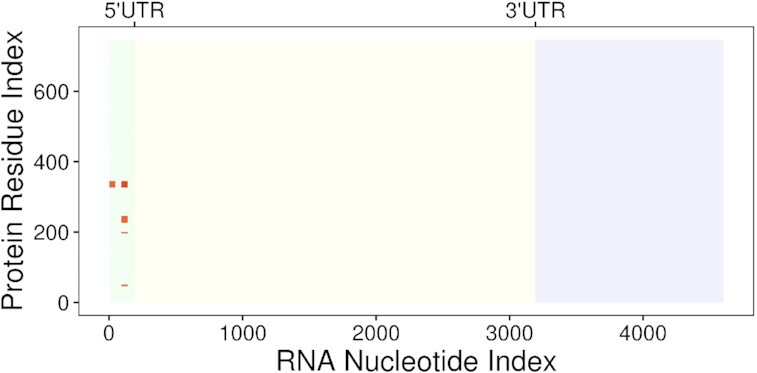
Figure 3.

Example of interaction map describing the binding between a generic RBP and an mRNA. Red marks correspond to the predicted binding regions, the intensity being proportional to the interaction propensity (8). 5′UTR label indicates the end of the 5′ Untranslated Region, while 3’UTR marks the start of the 3’ Untranslated Region.
