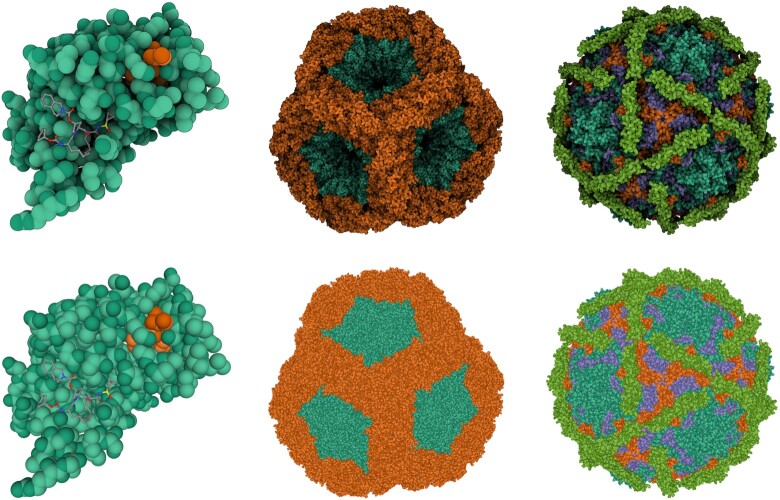
Figure 2.
The effect of lighting modes and representations on the clarity of the visualization. PDB entries (left to right) 4ktc, 5fj5 and 1upn rendered using different lighting modes and representations. Top row: screen-space ambient occlusion and outline. Bottom row: direct light and ambient light. An interactive version of this figure is available at the Mol* Viewer web page (https://molstar.org/).

