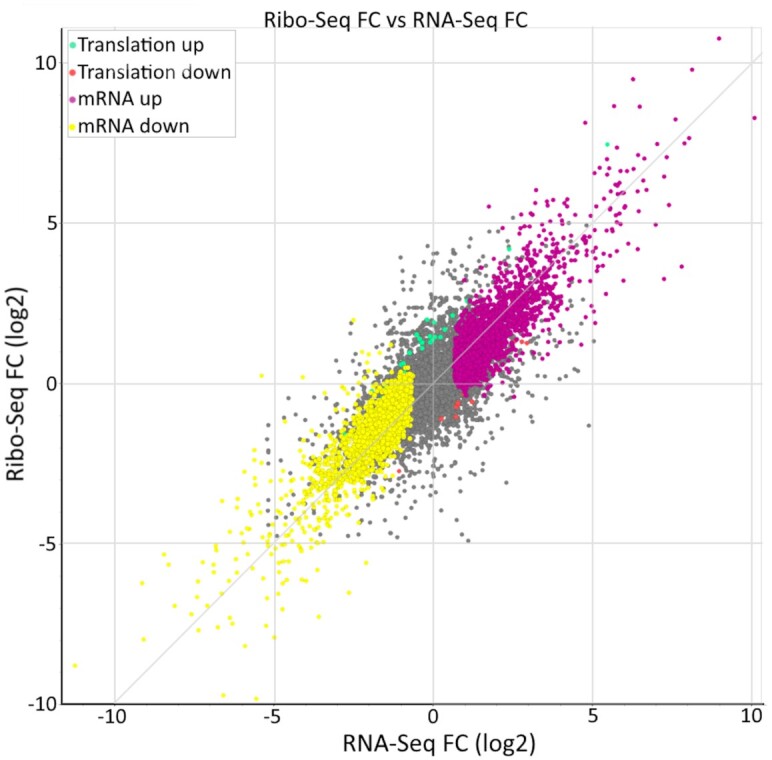
Figure 3.

An example of the differential gene expression analysis using DESeq2, using data from Iwasaki et al. (52). Genes whose expression did not change significantly are coloured grey, translationally upregulated/downregulated genes are in green/red, while changes in mRNA levels are in purple/yellow. Hovering over any of the points on the plot triggers a pop-up window with information specific to the corresponding gene/transcript and fold changes. Clicking on any of the points invokes a separate tab showing the comparison plot for ribosome footprints mapped to the corresponding gene.
