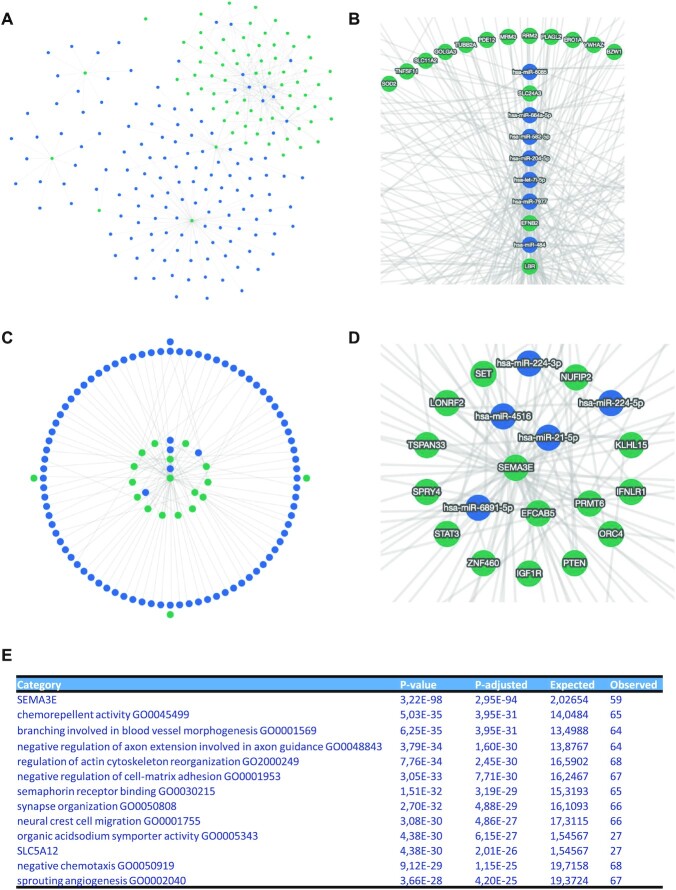
Figure 3.
Use case 2—aniridia genes and miRNAs. (A) Interactions between downregulated miRNAs (blue nodes) and upregulated genes (green nodes) with a minimum of three shared targets. (B) The enlarged core part of the interaction network shown in (A). (C) The opposite case upregulated miRNAs and downregulated genes. (D) The enlarged central part of the interaction graph shown in (C). (E) Top 10 significant miEAA pathways for the network in panel (C). Following the category name, the raw and adjusted P-value are provided, followed by the expected number of miRNAs by chance and the actual observed number.

