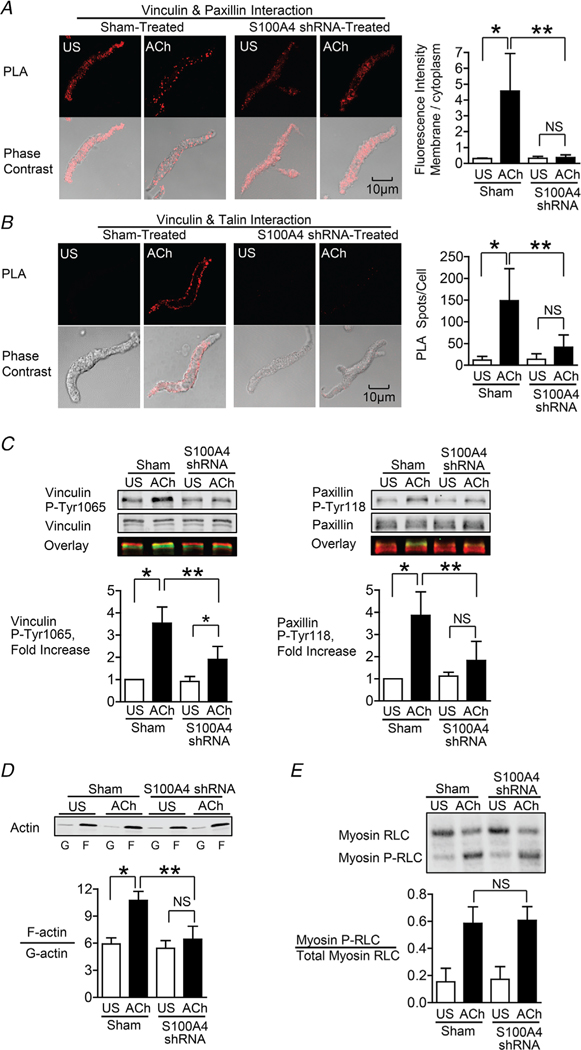
Figure 3. S100A4 depletion inhibits the membrane localization and activation of vinculin and paxillin, and S100A4 depletion inhibits actin polymerization but does not affect myosin RLC phosphorylation.
A and B, in situ PLA fluorescence and PLA fluorescence merged with phase contrast from unstimulated (US) or ACh stimulated cells freshly dissociated from sham-treated or S100A4-depleted tissues. A, paxillin–vinculin complexes are distributed throughout the cytoplasm of unstimulated cells from both sham-treated and S100A4-depleted tissues. ACh stimulation resulted the localization of paxillin–vinculin complexes to the membrane of sham-treated cells (US, n = 13; ACh, n = 15, p = 0.0001), whereas paxillin–vinculin complexes remained distributed throughout the cytoplasm of S100A4-depleted cells (US, n = 12; ACh, n = 14, p = 0.0001). B, ACh stimulation resulted in a marked increase in the number of talin–vinculin complexes at the cell membrane in sham-treated cells (US, n = 21; ACh, n = 29, p = 0.0001). S100A4 depletion inhibited the ACh-induced increase of the interaction between talin and vinculin at the cell membrane (US, n = 26; ACh, n = 30, p = 0.0681). Few spots were observed in S100A4-depleted treated cells with or without stimulation. C, representative immunoblots from extracts of sham-treated muscle tissues and S100A4 shRNA-treated tissues stimulated with ACh or not stimulated (US). The increases in vinculin Tyr1065 phosphorylation and paxillin Tyr118 phosphorylation in response to 10−5 M ACh were significantly inhibited in tissues depleted of S100A4 (n = 6, p = 0.0001). D, immunoblot of soluble G-actin (globular) and insoluble F-actin (filamentous) in fractions from extracts of unstimulated (US) or ACh-stimulated muscle tissues treated with S100A4 shRNA or sham-treated. Ratios of F-actin to G-actin were determined by quantitating F and G actin in extracts from each muscle strip. Depletion of S100A4 prevented the increase in the F-actin/G-actin ratio in response to ACh (n = 4, p = 0.0003). E, representative immunoblot of unphosphorylated and phosphorylated 20 kDa myosin RLCs from extracts of sham-treated or S100A4 shRNA-treated tissues stimulated with ACh or unstimulated (US). Depletion of S100A4 did not significantly affect myosin RLC phosphorylation in response to ACh (n = 12, p = 0.5317). Myosin RLC phosphorylation was quantified as the ratio of phosphorylated myosin RLC (Myosin P-RLC) to total myosin RLC in each sample. Data are analysed by one-way ANOVA with repeated measures. All values are the mean ± SD. *Significant difference between unstimulated (US) and ACh. **Significant difference between sham and shRNA treatment groups. NS, no significant difference.

