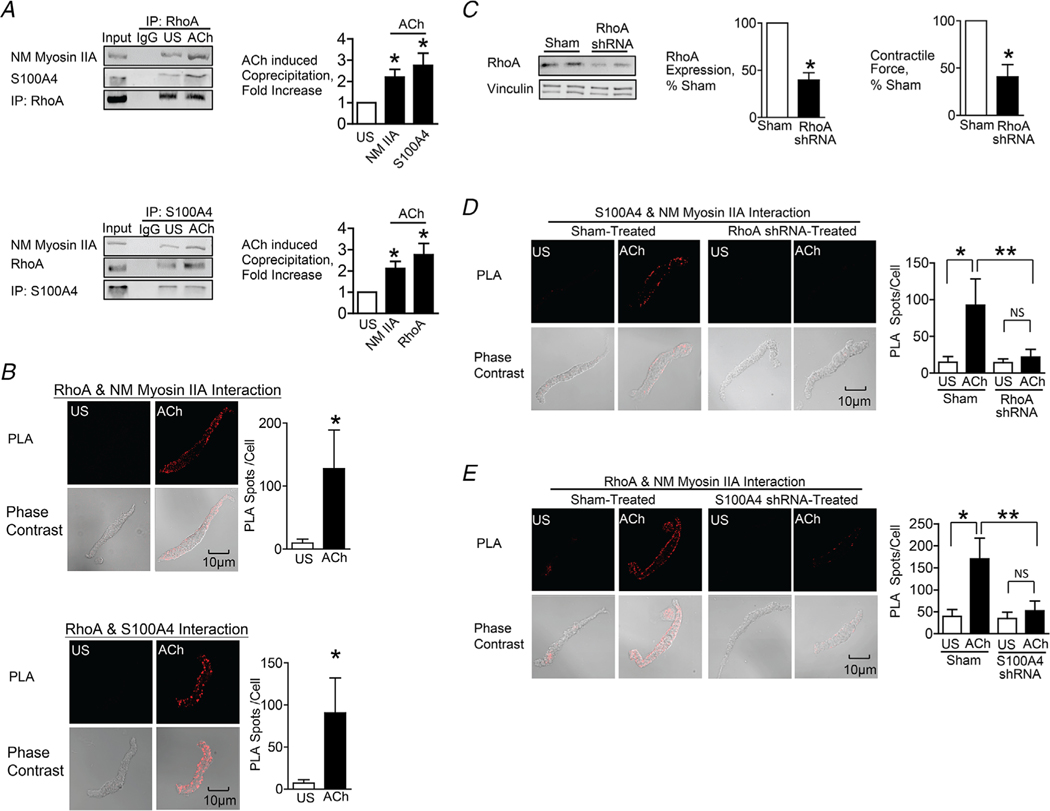
Figure 4. The interaction between S100A4 with NM myosin II in response to ACh is stimulated by the activation of RhoA.
A, RhoA or S100A4 was immunoprecipitated from extracts of SM tissues and immunocomplexes were blotted for RhoA, S100A4 and NM myosin IIA. Stimulation for 5 min with 10−5 M ACh significantly increased the amount of S100A4 (n = 6, p = 0.0007) and NM myosin IIA (n = 4, p = 0.0073) in RhoA immunoprecipitates. ACh stimulation increased the amount of RhoA (n = 6, p = 0.0005) and NM myosin IIA (n = 9, p = 0.0001) in S100A4 immunoprecipitates. B, in situ PLA was used to visualize the interaction of RhoA with NM myosin IIA and of RhoA with S100A4 in freshly dissociated tracheal SM cells. Stimulation with ACh caused a significant increase in the number of PLA spots at the cell membrane (RhoA and NM myosin IIA, n = 16 cells for both US and ACh, p = 0.0001); S100A4 and RhoA, n = 19 for US and n = 25 for ACh, p = 0.0001). C, tracheal SM tissues were depleted of RhoA protein using shRNA and RhoA was quantified in tissue extracts by immunoblotting (n = 8, p = 0.0001). Depletion of RhoA significantly inhibited tension development in response to 10−5 M ACh (n = 8, P < 0.0001). D, PLA was used to visualize interactions between S100A4 and NM myosin IIA in cells dissociated from sham-treated and RhoA-depleted tissues. ACh stimulation of sham-treated cells resulted in a significant increase in the number of interactions between S100A4 and NM myosin IIA (US, n = 27; ACh, n = 28, p = 0.0001). By contrast, few interactions were observed in cells from RhoA-depleted tissues (US, n = 26; ACh, n = 26 p = 0.5018). RhoA depletion inhibited the ACh-induced increase in interactions between S100A4 and NM myosin IIA (p = 0.0001). E, PLA shows interactions between RhoA and NM myosin IIA in cells dissociated from sham-treated tissues and S100A4-depleted tissues. ACh stimulation of sham-treated cells resulted in a significant increase in the number of interactions between RhoA and NM myosin IIA. By contrast, few interactions were observed in cells from S100A4-depleted tissues. (n = 26 for each group). S100A4 depletion inhibited the ACh-induced increase in the interaction between RhoA and NM myosin IIA (P = 0.0001). Data analysed by a paired Student’s t test (A and C), an unpaired Student’s t test (B) or by one-way ANOVA (D and E). All values are the mean ± SD. *Significant difference between US and ACh. **Significant difference between treatment groups. NS, no significant difference.

