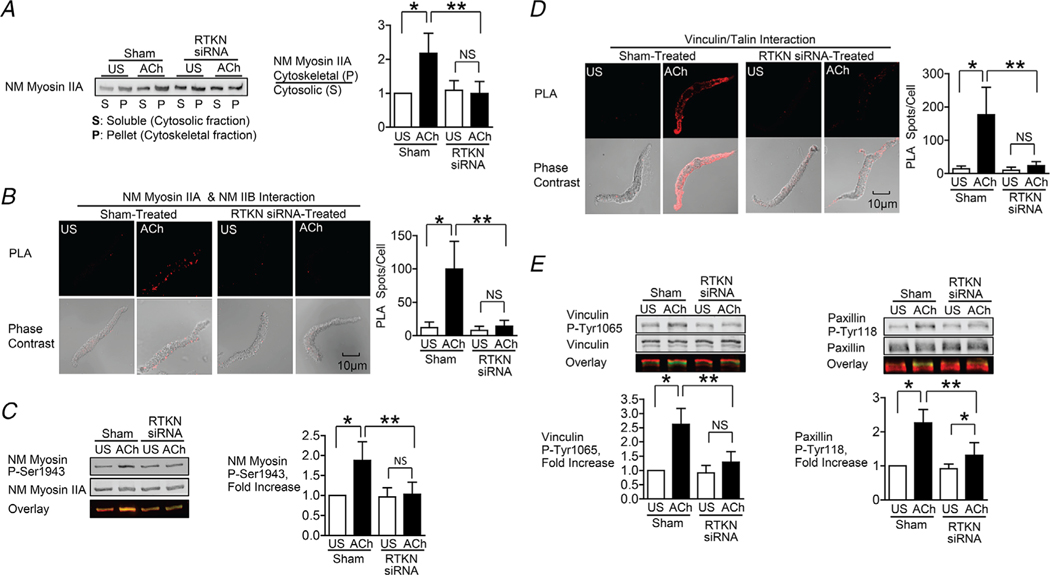
Figure 6. Depletion of rhotekin inhibits NM myosin II polymerization and membrane recruitment and activation of vinculin and paxillin in response to Ach.
A, immunoblot of NM myosin II in cytoskeletal (P) and soluble (S) fractions from extracts of tracheal SM tissues treated with RTKN siRNA or untreated (Sham) and stimulated for 5 min with 10−5 M ACh or unstimulated (US). RTKN depletion significantly inhibited the ACh-induced increase in the ratio of NM myosin II in the cytoskeletal (P) vs. soluble (S) fractions (n = 6, p = 0.0001). B, in situ PLA fluorescence in freshly dissociated US or ACh-stimulated SM cells from sham-or siRNA-treated tracheal SM tissues. ACh stimulation of sham-treated tissues resulted in a significant increase in the number of NM myosin IIA and IIB complexes at the cell cortex (n = 20 cells/group). RTKN depletion inhibited the ACh-induced increase in the interaction between NM myosin IIA and IIB (n = 20 cells/group, P = 0.0001). C, RTKN depletion significantly inhibited the increase in NM myosin II Ser1943 phosphorylation in tracheal muscle tissues in response to 5 min stimulation with 10−5 M ACh (n = 11, P = 0.0001). D, in situ PLA fluorescence shows interactions between talin and vinculin in US or ACh-stimulated freshly dissociated SM cells from sham-treated or RTKN-depleted tissues. ACh stimulation resulted in a significant increase in the number of talin-vinculin complexes at the cell membrane (US cells, n = 19; ACh, n = 25 cells, p = 0.0001). RTKN depletion inhibited the ACh-induced increase in the interaction between talin and vinculin (US, n = 18; ACh, n = 20, p = 0.0001). E, immunoblots of extracts from sham-treated and RTKN-siRNA treated tissues stimulated with Ach or US. The increase in vinculin Tyr1065 phosphorylation and paxillin Tyr118 phosphorylation in response to Ach was significantly inhibited in tissues with rhotekin depletion (n = 9, p = 0.0001). Data analysed by one-way ANOVA. All values are means ± SD. *Significant difference between US and ACh; **significant difference between treatment groups; NS, no significant difference.

