Figure 4.
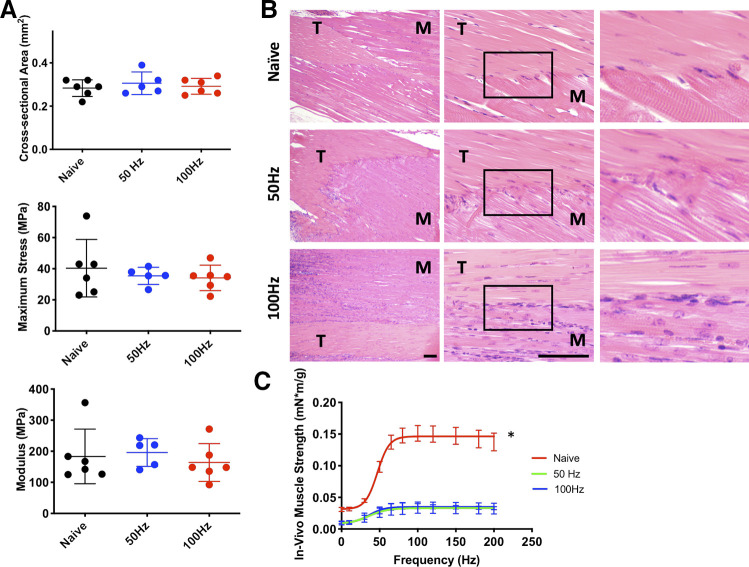
A: biomechanical outcome measures for 2 stimulation frequencies (50 vs. 100 Hz, applied to uninjured tendon). No significant differences between either treatment group compared with naïve untreated animals. B: hematoxylin-eosin (H&E) images of the myotendinous region. Top: sham control. Middle: 50-Hz stimulation. Bottom: 100-Hz stimulation. Left panel: 10x; middle panel: 40x; right panel: higher magnification insets of area in box in middle panel. M, muscle; T, tendon. Scale bars, 100 µm. C: muscle strength outcomes following 2 wk of treatment. *Significant differences from other groups. Errors bars denote means ± SD. Each scatterplot symbol denotes data from an individual mouse Achilles tendon. P < 0.05 was deemed to be statistically significant.

