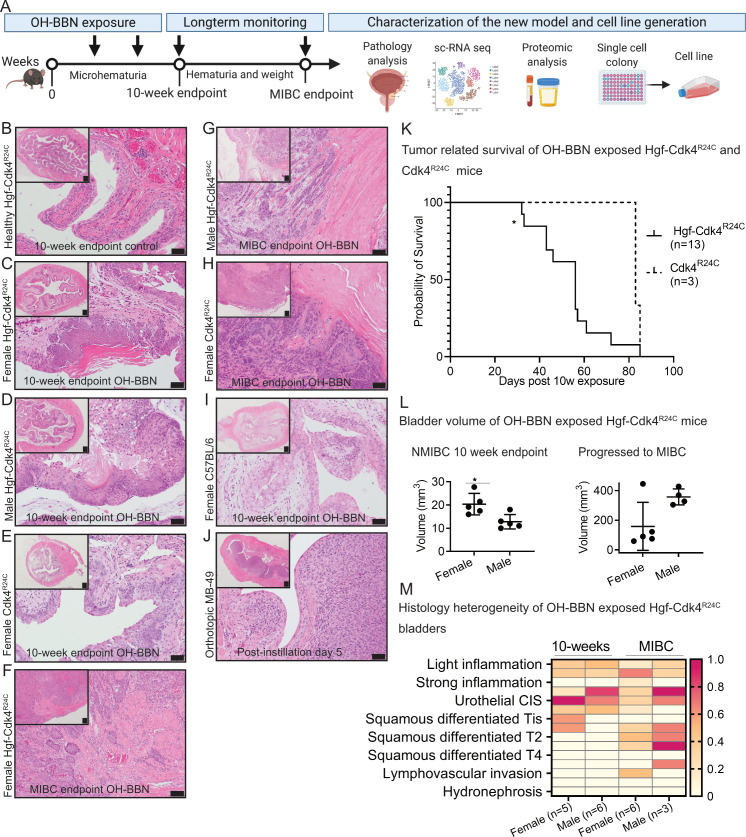
Fig 1. Development and characterization of the new Hgf-Cdk4R24C urothelial cancer model.
(A) Workflow summary of the model induction, timepoints setup and subsequent analyses. Representative images of bladder sections from (B) healthy female Hgf-Cdk4R24C, the 10-week OH-BBN induced (C) female Hgf-Cdk4R24C, (D) male Hgf-Cdk4R24C and (E) female Cdk4R24C mice. Representative images of the MIBC endpoint bladder sections from (F) female Hgf-Cdk4R24C, (G) male Hgf-Cdk4R24C, (H) female Cdk4R24C mice, and of (I) 10-week OH-BBN induced female C57BL/6 mice as well as (J) the orthotopic MB49 model at day 5. (Scale bars indicate 200 μm in all tissue overview images, 50 μm in enlarged images B-E and I-J, and 100 μm in enlarged images F-H.) (K) Survival was significantly shorter for Hgf-Cdk4R24C than for Cdk4R24C mice following 10-weeks OH-BBN exposure until reaching the humane endpoint due to tumor burden (p = 0.0377). (L) Bladder volume comparison between female and male Hgf-Cdk4R24C mice at the 10-week (p = 0.0317) and the MIBC endpoints (p = 0.1905). (M) A summary of heterogeneous histopathology findings on each murine bladder and kidney at the two endpoints (10-weeks OH-BBN female n = 5, male n = 6, MIBC females n = 6, males n = 3) in Hgf-Cdk4R24C mice. The heatmap scale indicates the fraction animals in each group that presented each histology.

