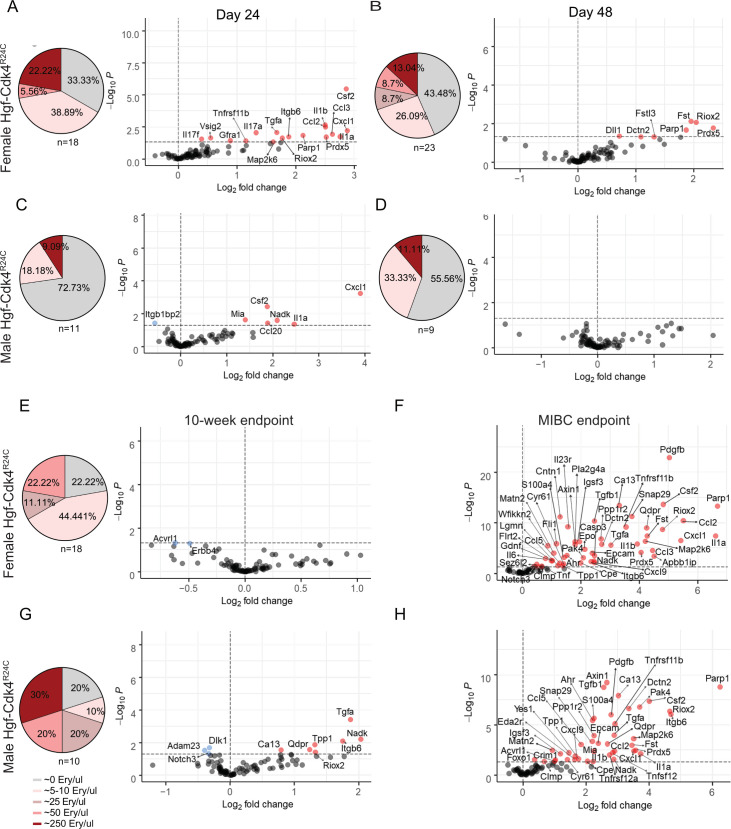
Fig 5. Microhematuria levels and sex specific protein alterations in urine over time in Hgf-Cdk4R24C OH-BBN induced mice depict events of carcinogenesis, early immune response and tumor progression.
From day 24 until the 10-week endpoint a percentage of animals presented none, low or high levels of microhematuria, expressed as erythrocytes/μl. At the MIBC endpoint gross hematuria was noted and therefore no microhematuria measurements were performed. Day 24 [(A) Females: n = 11 cancer, n = 3 healthy. (C) Males: n = 7 cancer, n = 3 healthy], day 48 [(B) Females: n = 11 cancer, n = 3 healthy. (D) Males: n = 6 cancer, n = 3 healthy], 10-week endpoint [(F) Females: n = 11 cancer, n = 6 healthy. (H) Males: n = 7 cancer, n = 7 healthy], MIBC endpoint [(G) Females: n = 5 cancer, n = 4 healthy. (I) Males: n = 3 cancer, n = 4 healthy]. Repeated measurements were analyzed by a generalized least square (GLS) to model the effect of gender on the disease at a specific time point. Fold change was calculated as 2(mean NPX cancer—mean NPX healthy control). Colored circles indicate significance level of p<0.05; red for increased proteins and blue for decreased proteins for each time point compared to healthy controls, grey circles show proteins below the significance level.

