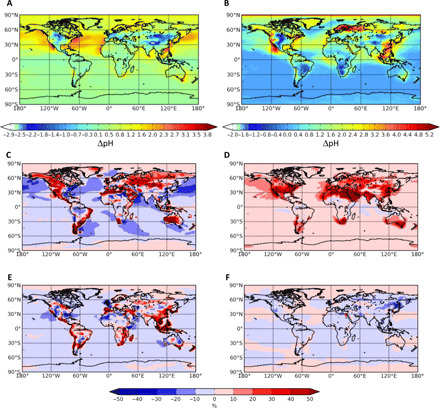
Fig. 2. Impact of anthropogenic and biomass burning emissions changes (1850 to 2010) on aerosol pH and nutrient wet deposition fractions.

Change in the annual mean near-surface (A) fine aerosol pH and (B) coarse aerosol pH and the change in the fractions of (C) wet NH4+ to the total NHx, (D) wet NO3− to the total NO3, (E) wet L-Fe to the total L-Fe, and (F) wet L-P to the total L-P between 1850 and 2010. (C to F) The difference between 1850 and 2010, expressed as a percentage of the 2010 condition. Negative values denote higher values in 2010 than in 1850. Reference figures (aerosol pH and wet to the total deposition ratios) for 2010 and maps of the difference between 2100 and 2010 are provided in figs. S1, S4, and S5.
