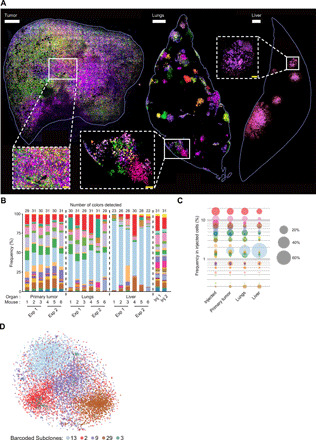
Fig. 2. Visualization and quantification of metastatic burden at single-cell resolution in whole organs.

(A) Representative images obtained by confocal imaging of the primary tumor (left), the lungs (middle), and the liver (right). Insets, magnified images. The white bars represent 500 μm and the yellow bars 100 μm. (B) Stacked histogram indicating the frequency (%) of each color-coded subclone detected in the primary tumors and lung and liver metastases of six different recipient mice. These results summarize two independent experiments (Exp 1 and Exp 2), with the cell population analyzed at the time of injection on both occasions (Inj 1 and Inj 2). Organs were harvested at metastatic end point and digested before quantification using flow cytometry. (C) Average subclonal frequency in the injected population, the primary tumor, and the lung and liver metastases from the six mice shown in (B). Each dot represents a color-coded subclone, and the size of the dot represents the frequency of the subclone. The y axis represents the frequency of each subclone, ranked according to their frequency in the injected population (D) t-distributed stochastic neighbor embedding (t-SNE) (perplexity = 50) of 10,418 single cells from five barcoded subclones (subclone 13, 3224 cells; 2, 2712 cells; 9, 2566 cells; 29, 1778 cells; 3, 140 cells) representing a feature set (table S1) that was derived through a differential expression analysis between the dominant subclone 13 and the minor subclone 29.
