
Fig. 7. Effect of etanercept and birinapant treatments on the survival and heterogeneity of metastases.
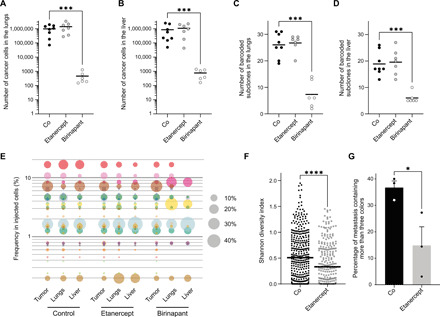
Mice with BSVTK-labeled MDA-MB-231 tumors were treated with saline (Co), etanercept (10 mg/kg) three times weekly, or birinapant (30 mg/kg) three times weekly, after resection of the primary tumors. Number of cells detected by flow cytometry in (A) lungs and (B) liver of mice treated with saline, etanercept, or birinapant. Number of colors detected by flow cytometry in (C) lungs and (D) liver. For (A) to (D), each dot represents a mouse. Mann-Whitney test, ***P = 0.0007. (E) Bubble plot indicating the frequency of the barcoded subclones (ranked according to their frequency in the injected cells). Each dot is a barcoded subclone, and its size correlates to its frequency, determined by flow cytometry. (A to E) The number of mice is n = 8 for the control, 7 for the etanercept, and 6 for the birinapant. (F) Shannon diversity indexes of individual lung metastases, quantified by imaging. Each dot is a metastasis in the control (n = 3 mice, three sections per lung, 388 metastases) or etanercept (n = 3 mice, three sections per lung, 312 metastases) group. (G) Percentage of metastases containing more than three colors in the control or etanercept group. Each dot represents an average of the percentages obtained for an individual mouse (n = 3 mice, three sections per lung). Error bars represent SEM. (F and G) Unpaired t test. ****P < 0.0001 and *P = 0.0418.