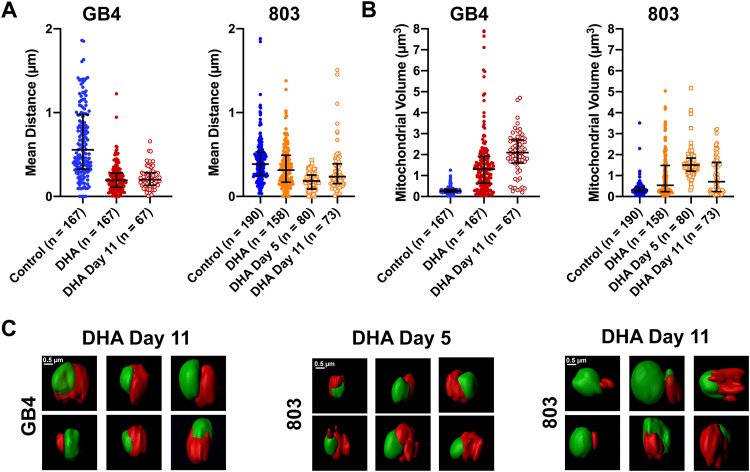
FIG 3.
Quantifications of mito-nuclear distances and mitochondrial volumes of GB4 and 803 parasites at t = 50 h, day 5, and day 11 after DHA treatment. (A) Scatterplots, medians, and interquartile ranges (IQR) of mito-nuclear distances in the populations of GB4 and 803 parasites exposed to 0.1% DMSO (control) or 700 nM DHA for 6 h, selected, sorted, and analyzed as described in the text. In the mito-nuclear distance scatterplots, there were five outliers beyond the bounds of the y axis in the GB4 control group (at 2.8 μm, 2.5 μm, 2.2 μm, 2.7 μm, and 6.8 μm), one outlier in the 803 control group (at 3.7 μm), and three outliers in the 803 DHA group (at 2.6 μm, 2.0 μm, 5.5 μm). (B) Mitochondrial volume scatterplots, medians, and IQR from the same populations used for mito-nuclear distance determinations. (C) Middle panel presents representative ASM images of DHA-treated/sorbitol-selected 803 parasites on day 5 posttreatment. The six examples of persisters show rumpled, corrugated mitochondria in close approximation to the nuclei. The right and left panels present the surface images of DHA-treated/sorbitol-selected GB4 and 803 parasites at day 11. Persister morphologies are evident in the images from each parasite line, including rumpled and corrugated mitochondria in close approximation to the nuclei.

