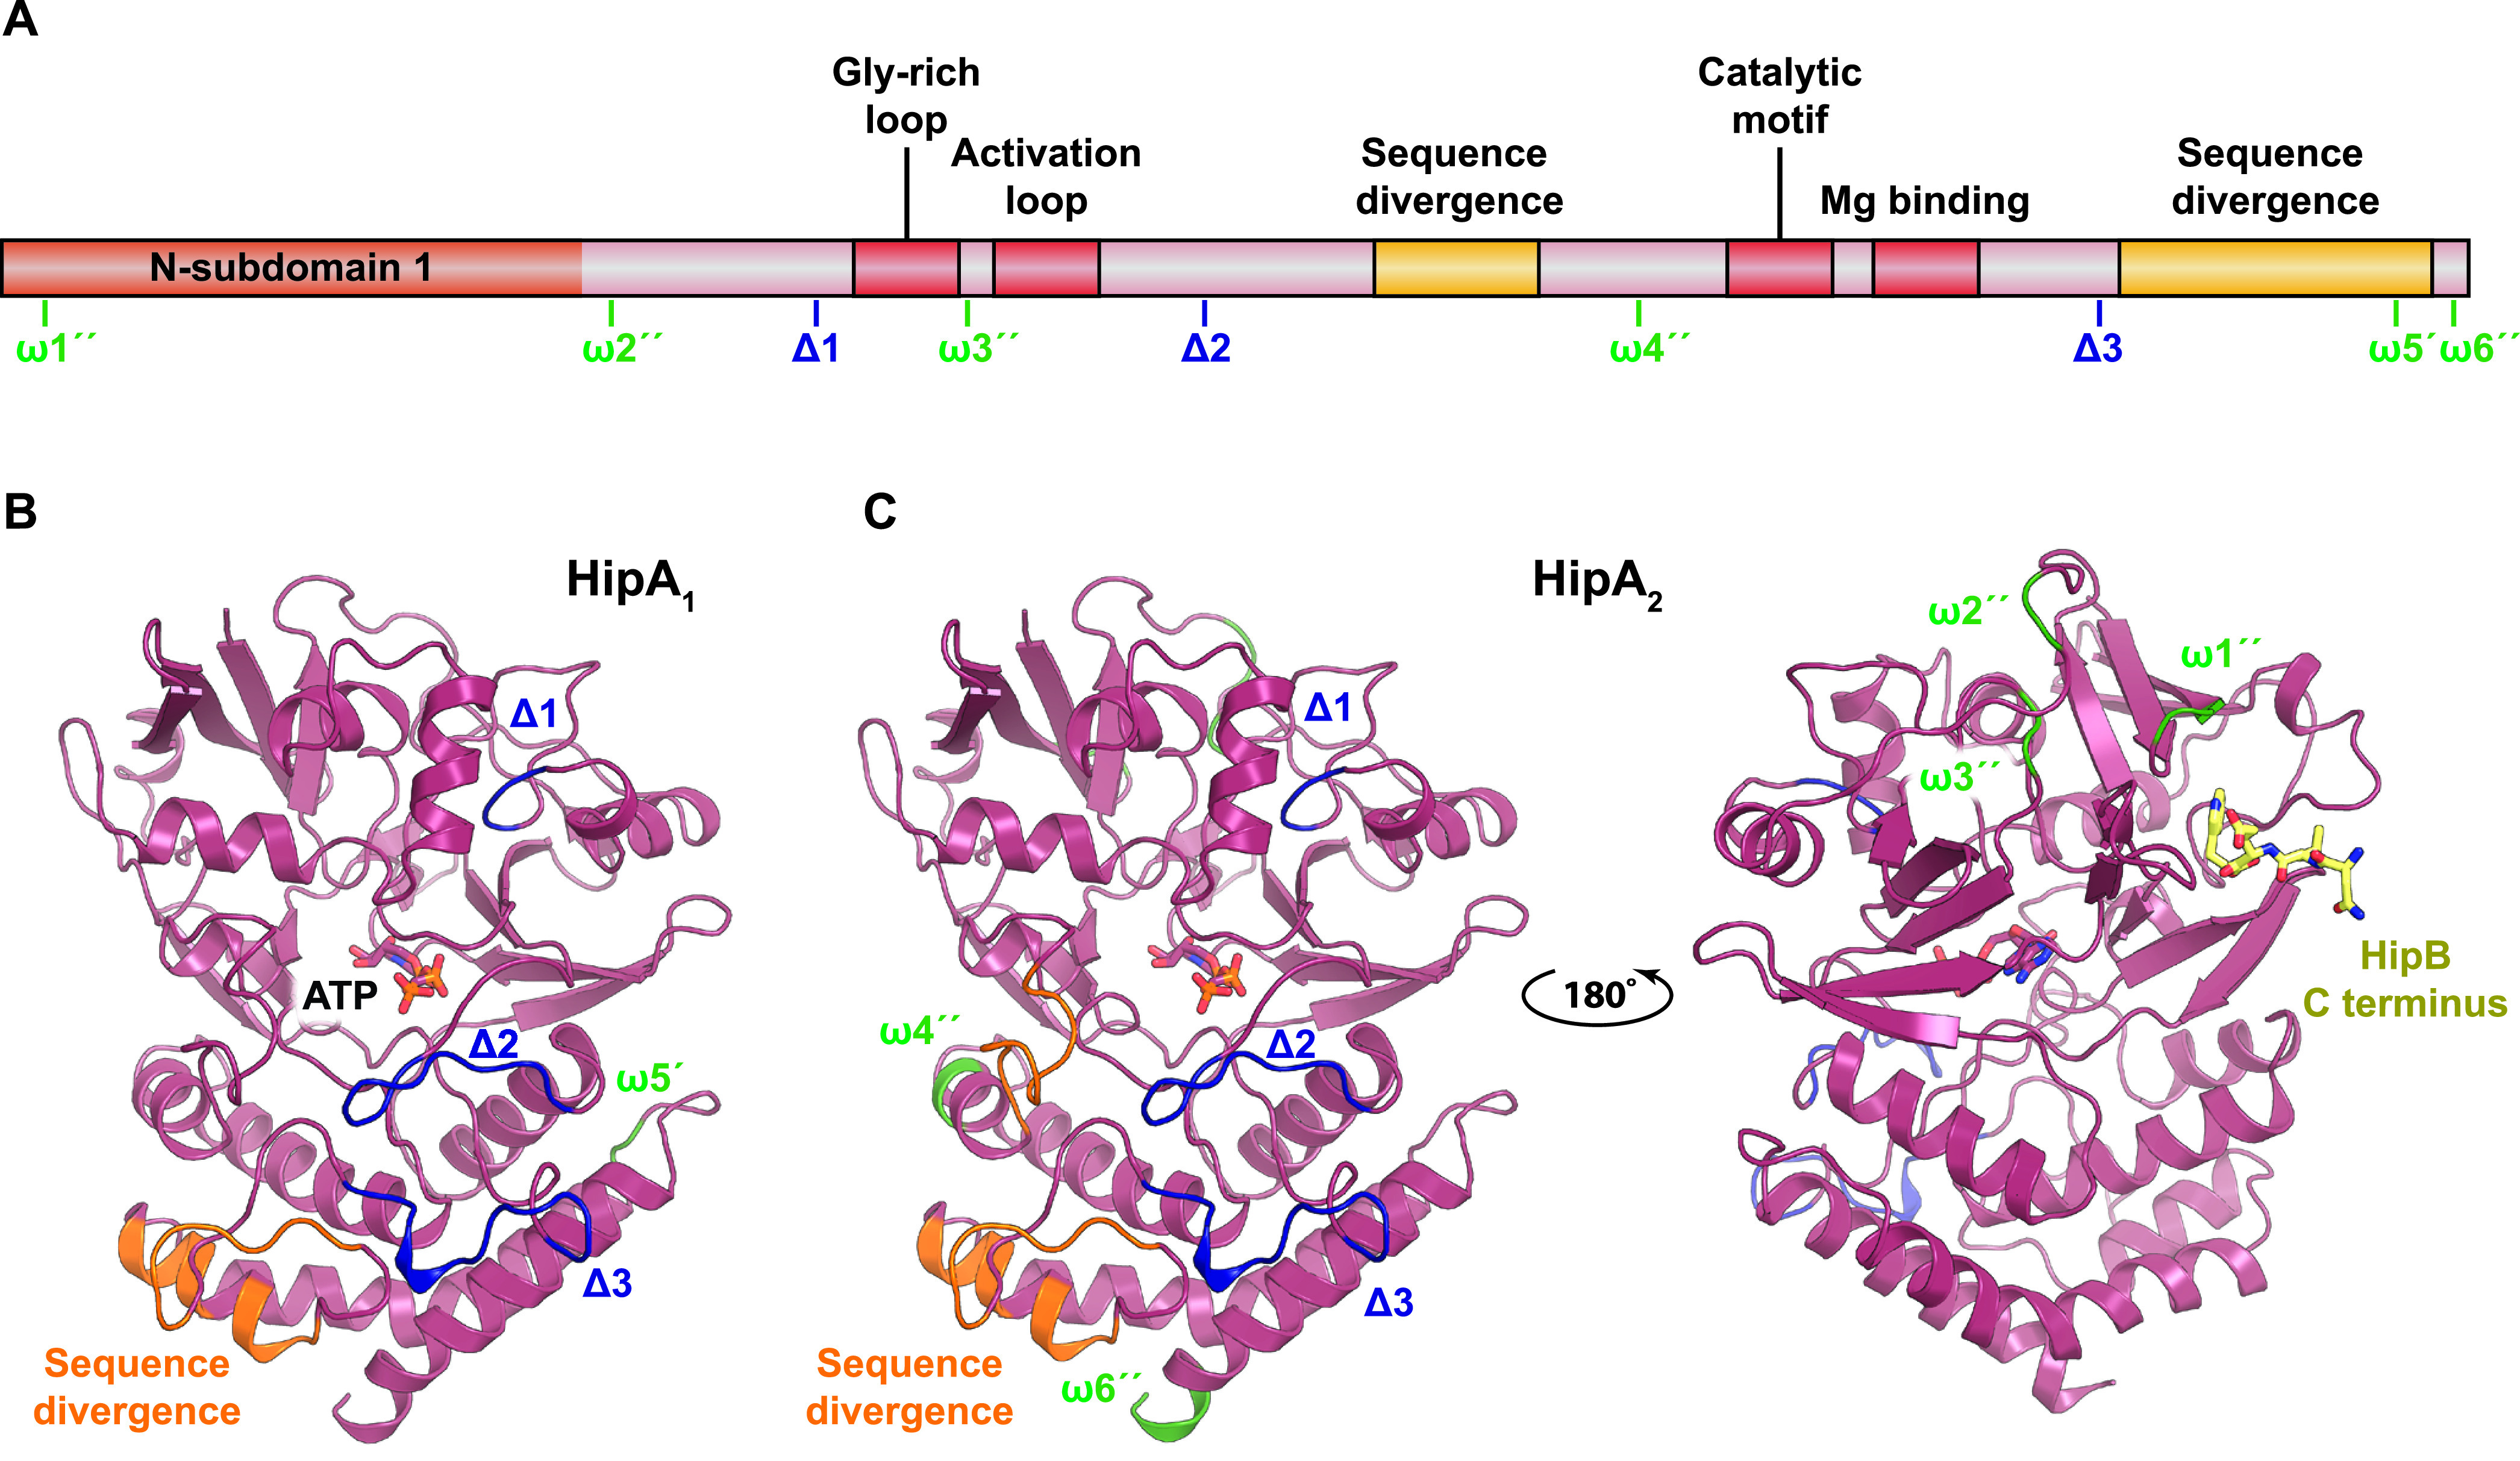
FIG 3.

Structural mapping of insertions and deletions observed in characterized HipA kinases. (A) Schematic overview of HipA showing the conserved regions (the Gly-rich loop, activation loop, catalytic motif, and Mg-binding motif) in red as well as insertions (ω [green]) and deletions (Δ [blue]) in C. crescentus HipA1 and HipA2 relative to HipA from E. coli K-12 based the sequence alignment shown in Fig. S3. An insertion in HipA1 relative to HipA is denoted ω5′, while insertions in HipA2 relative to HipA are marked ω1″, ω2″, ω3″, ω4″, and ω6″. Deletions in HipA1 and HipA2 relative to HipA are marked Δ1, Δ2, and Δ3. Regions of high sequence divergence are shown in yellow. (B) Mapping of the insertions and deletions in HipA1 onto the structure of HipA of E. coli K-12 (PDB accession no. 3FBR) using the same nomenclature and color scheme as in panel A (45). ATP is shown with colored sticks. (C) Mapping of the insertions and deletions in HipA2 onto the structure of HipA. Note that the insertions ω1″ and ω3″ in HipA2 are located close to the region that in HipA interacts with the C terminus of HipB (yellow sticks) and could perhaps affect antitoxin activity.
