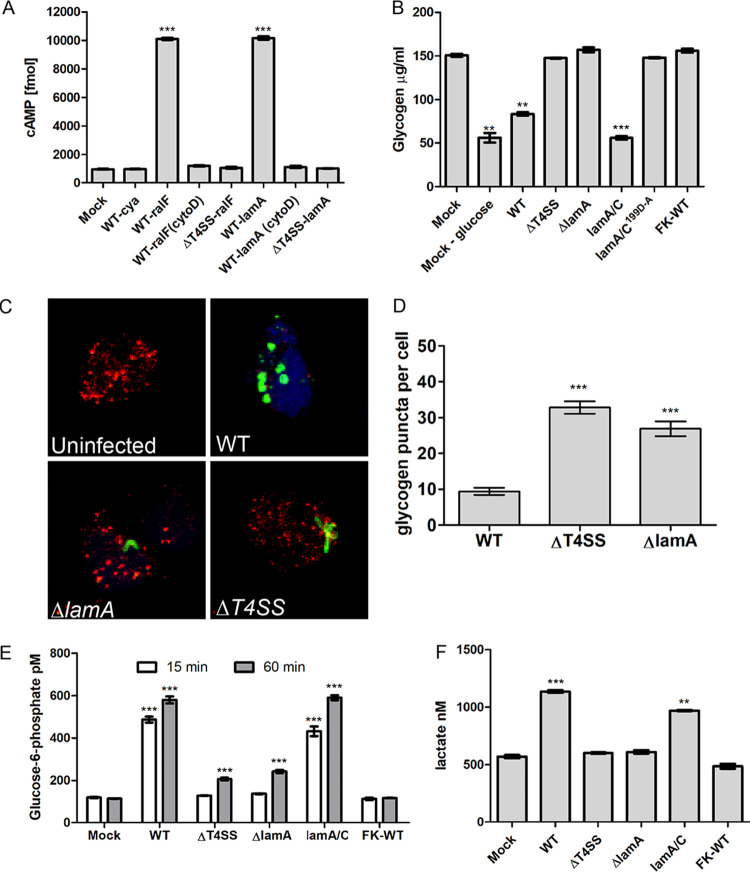
FIG 1.
Dot/Icm-injected LamA triggers glycogenolysis in PMNs, resulting in cytosolic hyperglucose and upregulated glycolysis. (A) Adenylate cyclase (Cya) reporter fusion translocation assays of LamA expressed by wild-type L. pneumophila and the translocation-deficient ΔT4SS mutant. The Cya-RalF effector fusion was used a positive control. PMNs were infected for 1 h in triplicate, and cAMP production was assessed by ELISA. To prevent phagocytosis, cytochalasin D was used. Data are shown as mean cAMP concentration ± SD, n = 3. ***, Student's t test of WT-RalF or WT-LamA versus WT-Cya; P < 0.0001. (B) Quantification of cytosolic glycogen concentrations in PMNs starved of glucose or infected wild type, ΔT4SS, ΔlamA or lamA/C and its catalytically inactive mutant, and formalin-killed wild-type bacteria at 1 h postinfection. Data are shown as mean glycogen concentration ± SD; n = 3. **, **, and ***, Student's t test of mock minus glucose cells, WT, or lam/C versus mock-treated cells; P = 0.0037, P = 0.0014, and P = 0.0007, respectively. (C) Representative z-stack confocal microscopy images of PMNs infected with various L. pneumophila strains (green) and glycogen granules were labeled by antibody (red). (D) Quantification of glycogen granules per cell at 15 min postinfection. Glycogen granules were counted in z-stack confocal images, and data points show mean granules/infected cell ± SD (n = 100 infected cells) and are representative of three independent experiments. ***, Student's t test of glycogen granules in either ΔT4SS- or ΔlamA-infected cells versus wild type-infected cells; P < 0.0001. (E) Quantification of cytosolic glucose-6-phosphate levels in PMNs infected with L. pneumophila strains at 15 and 60 min postinfection. Data are shown as mean glucose-6-phosphate concentration ± SD, n = 3. ***, Student's t test of glucose-6-phosphate levels in either wild type- or lamA/C-infected cells versus uninfected cells; P < 0.0001. (F) Lactate levels in cell culture supernatants of PMNs infected for 1 h with wild type, ΔT4SS, ΔlamA, lamA/C, or formalin-killed wild type. Data represent the mean lactate concentration ± SD, n = 3. *** and **, Student's t test of lactate level in the culture supernatant of wild type or lamA/C-infected PMNs versus mock-infected cells; P < 0.001 and P < 0.0013, respectively. Unless otherwise stated, n represents technical replicates, and data shown are representative of three independent biological replicates.

