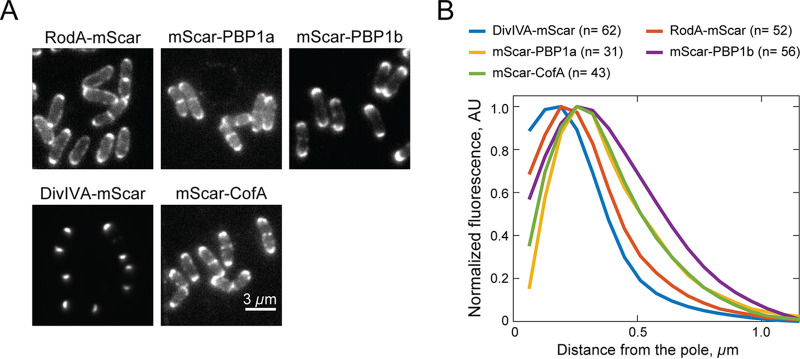
FIG 6.
Spatial distribution of RodA and the aPBPs at the cell poles. (A) Representative fluorescence micrographs of Cglu cells producing the indicated mScar fusions as the sole copy of the corresponding genes either from the native locus (DivIVA-mScar, strain HL23) or integrated plasmids pJSW19 (mScar-PBP1a) in strain HL37 (ΔponA), pJSW18 (mScar-CofA) in strain JS8 (ΔcofA), pJWS94 (mScar-PBP1b) in strain JS20 (ΔponB), or pJWS33 (mScar-RodA) in strain HL31 (ΔrodA). Overnight cultures grown in BHI medium at 30°C were diluted 1:1,000 in BHI medium supplemented with 0.3 mM theophylline and grown at 30°C. When the OD600 reached 0.2 to 0.3, cells were diluted 10-fold and loaded into a CellASIC microfluidic device for imaging by fluorescence microscopy. (B) Quantification of polar fluorescence distributions of the indicated mScar fusions. Following cell segmentation by Oufti (48), a MATLAB-based script was used to identify the brightest pole of each cell, aligning the cells by setting the tip of the brightest pole to position zero. The average fluorescence intensity distribution across all cells as a function of distance from the pole was then quantified. The fluorescence profiles shown were plotted following background subtraction.

