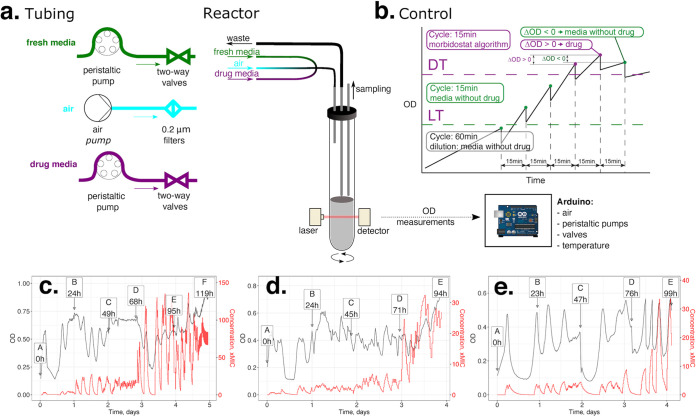
FIG 1.
(a to e) Morbidostat design (a), control logics (b), and examples of evolutionary runs of E. coli (c), A. baumannii (d), and P. aeruginosa (e) with ciprofloxacin. (a) Bacterial populations are continuously cultured in a 20-ml glass tube (bioreactor) with magnetic stirring and three input lines: filtered air (blue) and media from two feed bottles, with and without a concentrated drug (purple and green, respectively). The growth (turbidity) is monitored using a laser beam and diode light sensor. Upon periodic addition of 2 to 4 ml medium from the first or the second feed bottle (as defined by control logic, see B), the excess volume is displaced by airflow into a waste bottle. Samples (up to 10 ml) are taken periodically (1 to 2 times per day) through a dedicated sampling port. Our current morbidostat implementation includes 6 parallel bioreactors with individual feed lines that are independently monitored and controlled by the Arduino board with a Windows PC-based user interface. (b) Morbidostat logic is controlled by an Arduino board based on the principles described by Toprak et al. (27) using the real-time OD input from each bioreactor and predefined run parameters: a lower threshold (LT), a drug threshold (DT), and a cycle time (time between dilutions, typically 10 to 20 min when the OD is greater than the LT). Depending on the conditions shown in the diagram, one of the two peristaltic pumps (feeding media with or without drug) are engaged at the beginning of each dilution outgrowth cycle. (c to e) Representative OD profiles (black line) and calculated drug concentration profiles (red line) observed during the course of the experimental evolution of E. coli, A. baumannii, and P. aeruginosa toward resistance against ciprofloxacin (CIP). One of the reactors is shown for each organism, while evolutionary profiles for all other experiments and reactors are provided in Fig. S2. The right axis shows the CIP concentration (times the MIC) as a fold change from the MICs for respective unevolved strains.

