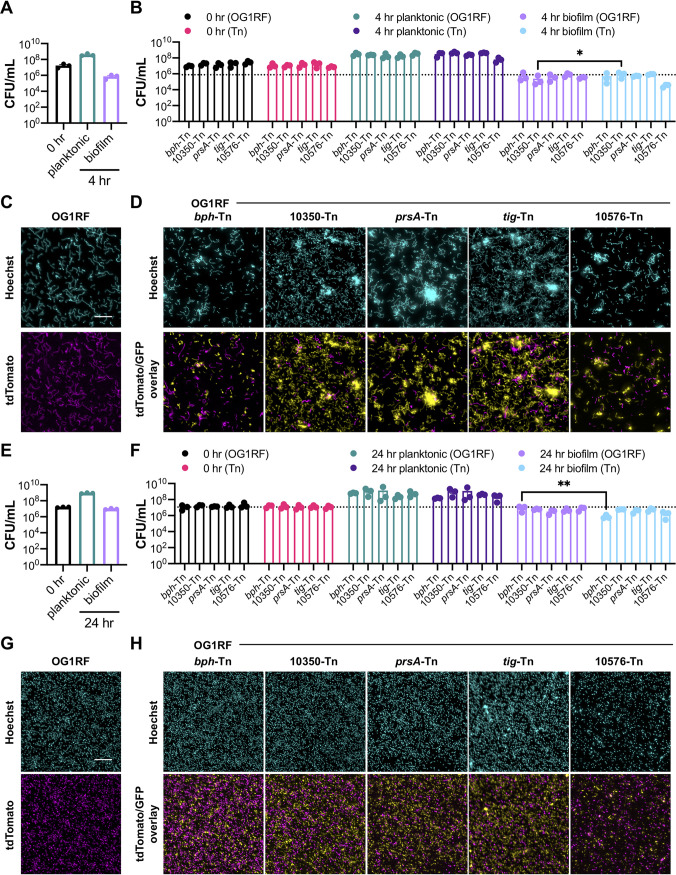
FIG 7.
Cocultures of OG1RF and Tn mutants in TSB-D in MultiRep reactors. (A) Numbers of CFU/ml of OG1RF at 0 h and 4 h. (B) Numbers of CFU/ml of OG1RF/Tn cocultures at 0 h and 4 h. The dotted line indicates the number of biofilm CFU/ml of OG1RF grown in monoculture (value taken from panel A). (C) Representative microscopy images of Hoechst 33342-stained OG1RF pP23::tdTomato biofilms at 4 h. (D) Representative microscopy images of Hoechst 33342-stained OG1RF pP23::tdTomato/Tn mutant pP23::GFP biofilms at 4 h. (E) Numbers of CFU/ml of OG1RF at 0 h and 24 h. (F) Numbers of CFU/ml of OG1RF/Tn cocultures at 0 h and 24 h. The dotted line indicates the number of biofilm CFU/ml of OG1RF grown in monoculture (value taken from panel E). (G) Representative microscopy images of Hoechst 33342-stained OG1RF pP23::tdTomato biofilms at 24 h. (H) Representative microscopy images of Hoechst 33342-stained OG1RF pP23::tdTomato/Tn mutant pP23::GFP biofilms at 24 h. For panels A, B, E, and F, each data point represents the average of two technical replicates, and a total of three biological replicates were performed. Statistical significance was evaluated by two-way ANOVA with Sidak’s multiple-comparison test (*, P < 0.05; **, P < 0.01; ***, P < 0.001; ****, P < 0.0001). For panels C, D, G, and H, samples were grown in parallel to cultures used to generate panels A, B, E, and F. Scale bars, 20 μm. Two technical replicates were processed for each biological replicate, and representative images are shown.

