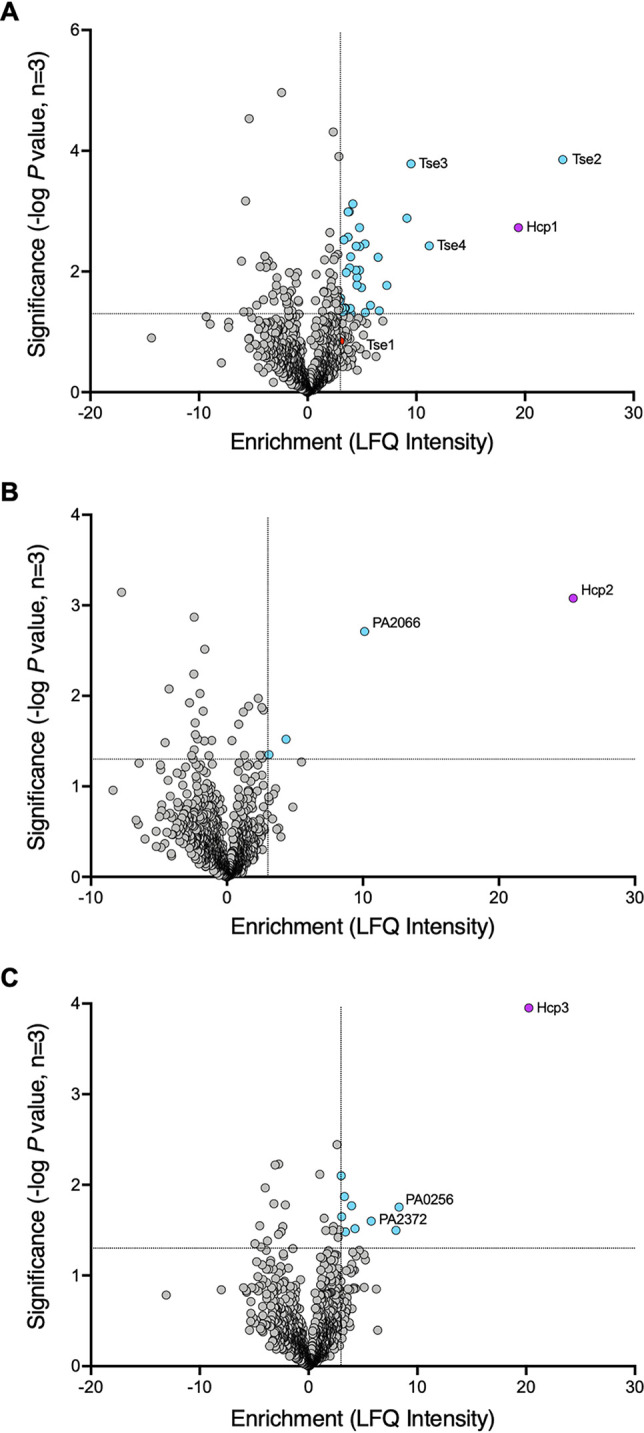
FIG 2.

Hcp1/2/3 pulldown hits. Volcano plots showing LFQ analysis of Hcp1-, Hcp2-, and Hcp3-FLAG pulldowns performed in P. aeruginosa. Results are from three independent experiments, and the full data sets are provided in Data Set S1 in the supplemental material. The x axes show the fold change in enrichment over the untagged Hcp control. The y axes depict the significance of the enrichment. Proteins plotted were not found to be enriched in the cognate VgrG-FLAG controls (Data Set S1). (A) Hcp1-FLAG pulldown results. The red dot is Tse1, a known Hcp1-delivered effector that was enriched 3-fold, but was below the significance cutoff. This was used as the enrichment baseline for possible hits. (B) Hcp2-FLAG pulldown results. (C) Hcp3-FLAG pulldown results. Dotted lines represent the enrichment cutoff of ≥3-fold, as determined by Tse1 and the significance cutoff −log10 P value of ≥1.3, which is equivalent to a P value of ≤0.05. Increasing significance on the y axis corresponds to a smaller P value. Blue dots are proteins above the enrichment and significance cutoffs. Purple dots are the bait Hcp proteins.
