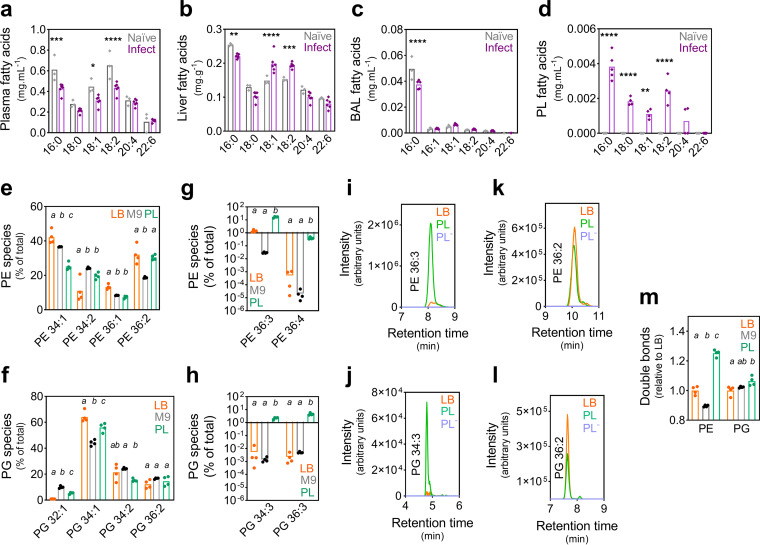
FIG 1.
The host and A. baumannii lipid landscape. (a to d) The fatty acids (milligrams of fatty acid per milliliter or gram of tissue) in the plasma (a), liver tissue (b), bronchoalveolar lavage (BAL) fluid (c), and pleural lavage (PL) fluid (d) of 9-week-old female BALB/c mice were examined prior to (Naïve) and 24 h after (Infect) intranasal challenge with A. baumannii strain AB5075_UW. Statistical analyses were performed using one-way analysis of variance (ANOVA) (Bonferroni test). *, P ≤ 0.05; **, P ≤ 0.01; ***, P ≤ 0.001; ****, P ≤ 0.0001. (e to h) The phosphatidylethanolamine (PE) (e and g) and phosphatidylglycerol (PG) (f and h) species (number of carbons:number of double bonds in the acyl chains) were quantified in A. baumannii cultured in Luria-Bertani (LB) or M9 medium or A. baumannii from the pleural lavage fluid of BALB/c mice 24 h after intranasal challenge, using liquid chromatography-mass spectrometry (LC-MS). (i to l) LC-MS chromatograms for heavily enriched lipid species in A. baumannii isolated from the PL fluid (PE 36:3 [i] and PG 34:3 [j]) and control lipid species present in A. baumannii from the PL fluid and those cultured in LB medium (PE 36:2 [k] and PG 36:2 [l]). The PL fluid from uninfected mice (PL−) is included as a control (no discernible signal). The data represent the averages from 4 biological replicates. (m) The relative number of double bonds of PE and PG species in A. baumannii from LB or M9 media, or the PL fluid was defined using the percent abundance. All statistical analyses in panels e to h and m were performed by one-way ANOVA (Bonferroni test), with different letters denoting statistical significance between samples, per phospholipid species.

