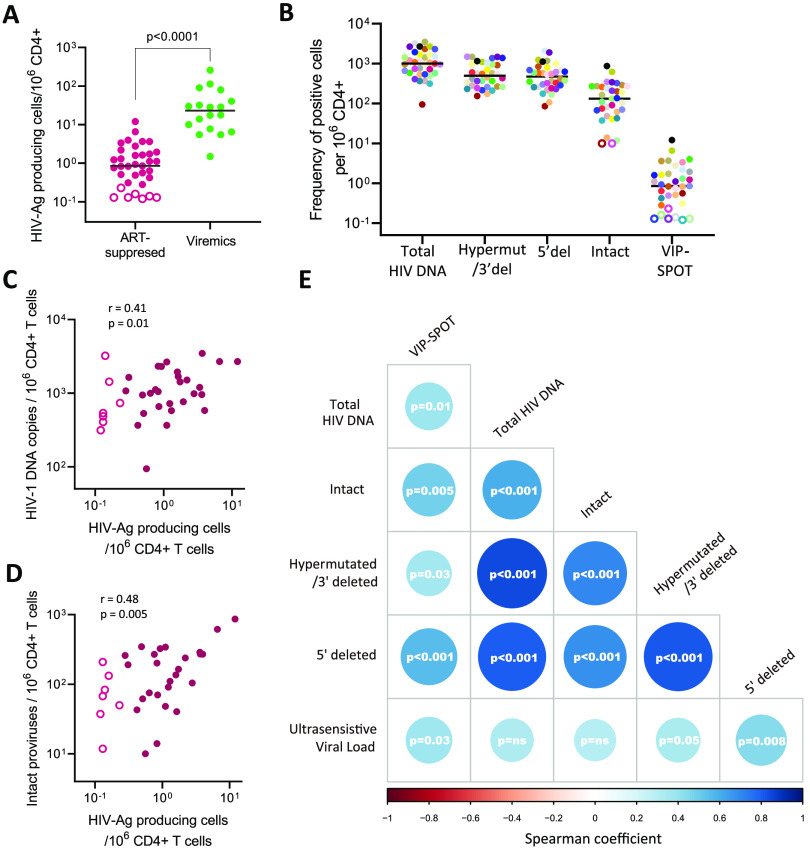
FIG 3.
Correlation between VIP-SPOT and other assays measuring the size of the HIV-1 reservoir in samples from ART-suppressed individuals. (A) Comparative analysis of the frequency of HIV antigen producing-cells in samples from viremic and ART-suppressed individuals. Open symbols indicate samples in which no spots were detected. For representation and for correlation analysis, we used half of the limit of detection, calculated based on the total number of cells assayed from each sample. (B) Frequency of HIV antigen-producing cells was compared with total, defective, and intact HIV DNA from the same ART-suppressed individuals. (C and D) Correlation between the frequency of HIV antigen-producing CD4+ T cells in peripheral blood and total HIV-1 DNA and intact proviruses, respectively. (E) Correlation matrices between all of the different HIV-1 reservoir measures evaluated, based on the result of Spearman’s rank correlation tests (n = 35). The size and color intensity of the circles indicates the strength and direction of the correlation (blue indicates a positive correlation); P values for each comparison are indicated.

