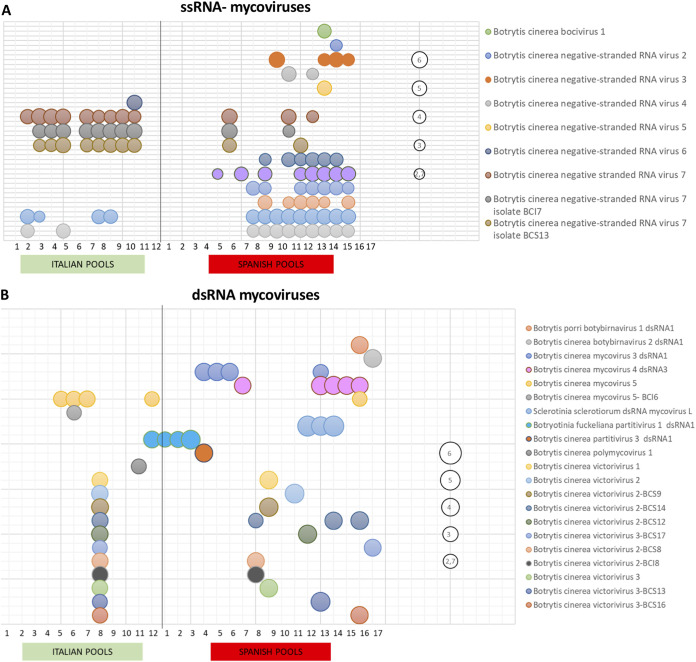
FIG 2.
Distribution and abundance of Botrytis cinerea ssRNA– and dsRNA mycoviruses within regions. Bubble charts based on the number of reads, with log10 transformation, per each mycovirus inside the pools are shown. A bubble of “2,7” represents 500 reads. (A) ssRNA– mycoviruses. (B) dsRNA mycoviruses.

