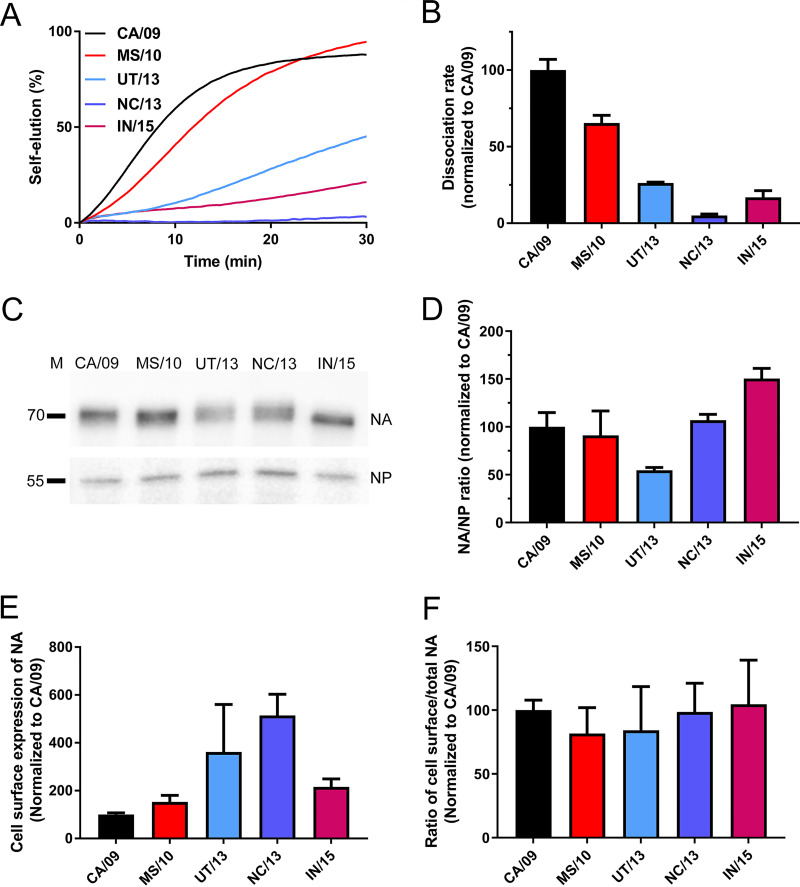
FIG 6.
NA enzymatic activity of recombinant viruses. (A) Recombinant viruses were allowed to bind to similar levels to sensors containing 6′LAMP1 in the presence of OC. After removal of OC by short washes, virion self-elution in the absence of OC was monitored. Dissociation of virus particles was normalized to the virus association levels in the presence of OC. Results of a representative experiment out of three is shown. (B) The maximum slope of the virus dissociation curve (shown in panel A) was calculated and normalized to that of the CA/09 virus. (C) Western blot analysis of NA and NP in virus preparations pelleted through a 20% sucrose cushion using monoclonal antibodies against NA and NP. The position of molecular mass markers is indicated on the left side of the gel (D) The intensity of the NA and NP protein bands was quantified using the Odyssey gel imaging system (Li-Cor), and the mean ratio (of two independent experiments) of NA/NP normalized to that of CA/09 is graphed. (E) Enzymatic activity of cell surface-expressed NAs using the MUNANA assay. (F) Ratio of cell surface-expressed NA to total cell-associated NA was determined by using the MUNANA assay. All results are means from three independent experiments. Standard deviations are indicated.

