FIG 1.
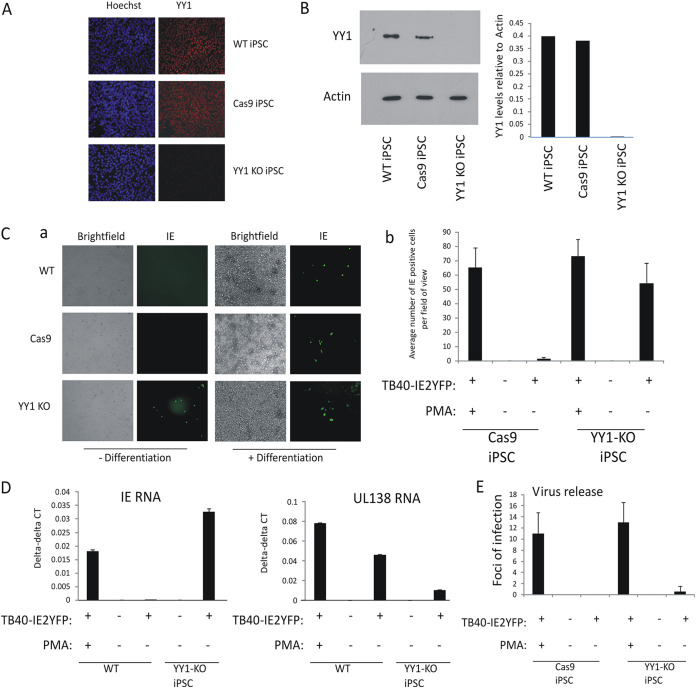
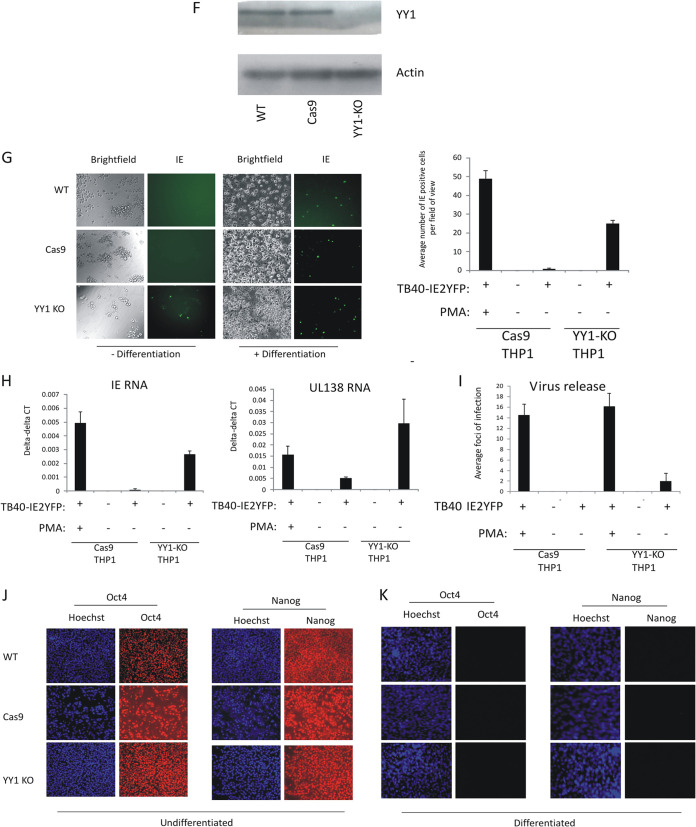
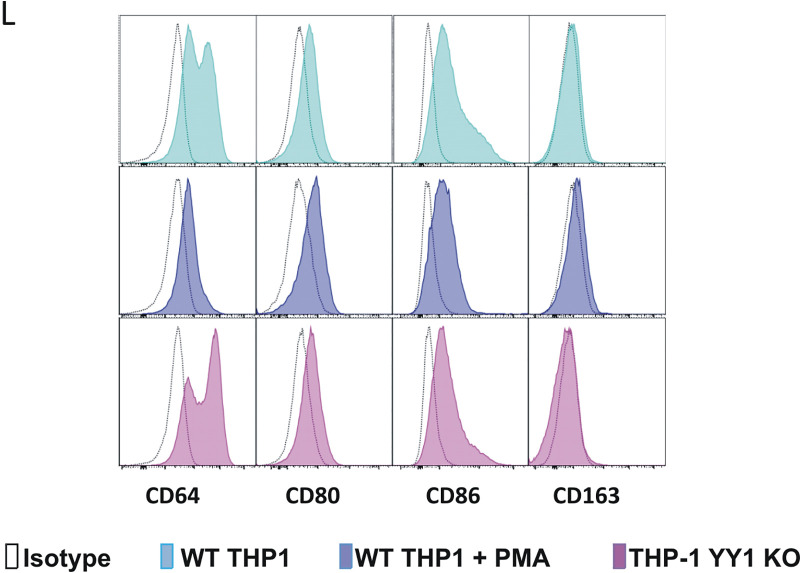
Cellular YY1 is required for HCMV latency. Wild-type iPSCs (WT-iPSCs), iPSCs which overexpressed Cas9 (Cas9-iPSCs), or which overexpressed Cas9 and were treated by CRISPR to remove YY1 (YY1-KO iPSCs) were stained for YY1 protein by indirect immunofluorescence staining (red), and the nuclei were costained with Hoechst (blue) (A). Alternatively, lysates from the same cells were analyzed by Western blotting for actin and YY1 proteins (B). (C) Undifferentiated iPSCs (- Differentiation) described for panels A and B) were infected with TB40E-IE2YFP and 4 days later analyzed by fluorescence for the presence of IE expression (green). This also included cells treated with PMA to induce differentiation (+ Differentiation) as a positive control for HCMV permissiveness. Bright-field images are also shown. Studies whose results are shown in panel C were performed in triplicate and enumerated (graph in panel C). Cells described for panel C were also harvested for RT-qPCR analysis and analyzed for IE expression and UL138 RNA relative to the housekeeping GAPDH gene (D). The supernatants from panel C were also transferred to fresh fibroblasts, and IE2-YFP-positive foci of infection in triplicate wells were counted after 9 days and enumerated (E). Wild-type THP1 cells (WT), THP1 cells which overexpressed Cas9 (Cas9), or which overexpressed Cas9 and a guide RNA to YY1 (YY1-KO) were harvested and analyzed by Western blotting for the housekeeping actin gene or YY1 as indicated (F). The experiment carried out for panel C was repeated using the THP1 cells described for panel F, and results are presented with graphical enumeration (G). The THP1 cells described for panel G were also harvested for RT-qPCR analysis of viral IE and UL138 genes alongside the housekeeping GAPDH gene (H). The supernatants from panel G were transferred to fresh fibroblasts, and IE2-YFP foci of infection in triplicate wells were counted after 9 days (I). The iPSCs described for panel A were also stained for the pluripotency markers Oct4 and Nanog (red) alongside a nuclear stain, Hoechst (blue) as indicated (J). The cells described for panel J were also differentiated prior to staining for Oct4 and Nanog (K). Finally, THP1 cells described for panel F were analyzed for the indicated differentiation markers by FACS (L). All graphs represent average values with standard deviation error bars.


