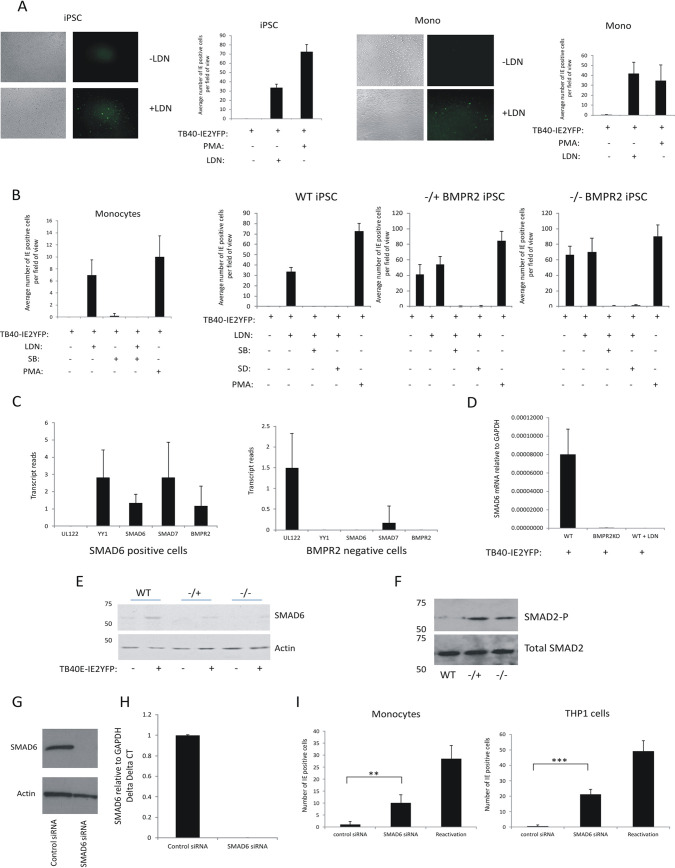
FIG 4.
BMPR2 inhibitor LDN prevents the establishment of HCMV latency in iPSCs and monocytes, but this can be rescued with TGFbeta inhibitors and BMPR2-stimulated SMAD6 aids maintenance of latency. Monocytes or iPSCs, as indicated, were infected with TB40E-IE2YFP for 4 days in the presence or absence of LDN (medium was changed daily and replaced with fresh LDN). Cells were then analyzed by IF for IE2-YFP and bright-field microscopy (left) (A). These cells were enumerated alongside a PMA-positive control, and the graph represents triplicate experiments in 5 fields of view of 100 cells each (right) (A). Monocytes, WT-iPSCs, BMPR2−/+ iPSCs, or BMPR2−/− iPSCs were infected with TB40E-IE2YFP in the presence or absence of LDN, SB431542, SD208, or PMA as indicated, with medium and drug changes every day for 4 days before enumeration of IE2-YFP-positive cells in 6 fields of view from 100 cells each from triplicate experiments. The graph shows mean values, with standard deviation error bars (B). iPSCs were infected with TB40E-GATA2mCherry for 4 days prior to sorting and analysis by single-cell RNA-seq analysis. Six cells were analyzed for numbers of transcripts of the UL122, YY1, SMAD6, SMAD7, and BMPR2 genes. Cells in the left graph were selected on the basis of the ability to detect SMAD6 transcript. Cells in the right graph represent cells which were BMPR2 negative. Graphs show mean values with standard deviation error bars (C). BMPR2−/− iPSCs and WT-iPSCs were infected with TB40E-IE2YFP and then either treated with LDN or left untreated as indicated prior to harvesting for RNA analysis. Levels of GAPDH and SMAD6 were determined by RT-qPCR. The data are from triplicate samples, and average delta delta CT values for SMAD6 relative to GAPDH are shown with standard deviation error bars. WT-iPSCs, BMPR2−/− iPSCs, or monocytes that had been treated with LDN were harvested for RT-qPCR analysis of SMAD6 RNA relative to the housekeeping GAPDH gene (D). WT-iPSCs and BMPR2−/+ and BMPR2−/− iPSCs were either left uninfected or infected with TB40E-IE2GFP for 4 days before harvesting for Western blotting and analysis for the presence of SMAD6 and actin proteins (E). The latently infected cells described for panel E were analyzed for total SMAD2 and phosphorylated SMAD2 by Western blotting (F). THP1 cells were nucleofected with an siRNA to SMAD6 and then left for 48 h before analysis of SMAD6 and actin proteins by Western blotting (G) and RNA by RT-qPCR; the graph represents delta delta CT with standard errors shown (H). Finally, CD14+ monocytes or THP1 cells were infected with IE2YFP-TB40E and left for 3 days (I). After 3 days, the cells were nucleofected with control siRNA or SMAD6 siRNA or, as a control, reactivated with GM-CSF/interleukin 4 (IL-4) and lipopolysaccharide (LPS) (I, left) or PMA (I, right). Cells were then enumerated for IE positivity. The graph represents 6 fields of view of 100 cells, with standard deviations and significance determined with Student’s t test (I).

