FIG 2.
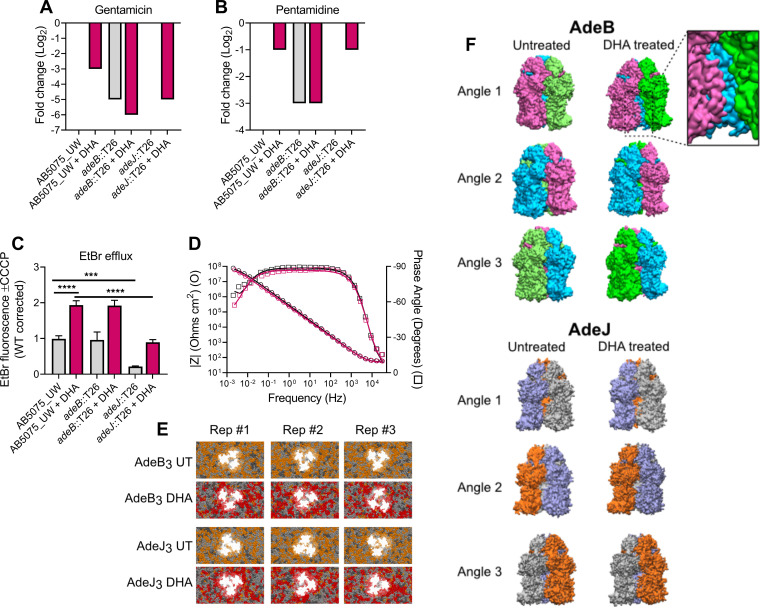
The interdependence of lipid homeostasis and RND efflux in A. baumannii. Fold changes in the MIC of gentamicin (A) or pentamidine (B) in AB5075_UW, adeB::T26, and adeJ::T26 strains, with or without DHA supplementation (250 μM), are shown. The data (mode) are representative of 6 biological replicates. The gray bars indicate untreated samples, and those in burgundy represent samples treated with DHA. The data represent no change from the untreated wild-type cells in cases where no bar is visible. (C) Accumulation of ethidium bromide (5 μM) in strain AB5075_UW and the adeB::T26 and adeJ::T26 strains, with or without 125 μM DHA. The efflux potential was defined by determining the difference between efflux-negative cells (40 μM CCCP) and actively effluxing cells (no CCCP). The data are representative of 8 or 4 biological replicates for the wild-type and the two mutants, respectively (±SEM). Statistical analyses were performed by analysis of variance (ANOVA) (***, P < 0.001; ****, P < 0.0001). (D) Bode plot of an untreated (UT [black]) and DHA-treated (purple) tBLM after formation. Symbols represent measured data (representative of 4 replicates), and solid lines represent a fit to an equivalent circuit of resistors and capacitors. (E) Snapshots from the final 5 μs of AdeB and AdeJ trimer simulations in the untreated and DHA-treated membranes. MD simulations were performed in triplicates (Rep #1, Rep #2, and Rep #3). Saturated lipids are shown in dark gray, monounsaturated lipids in light gray, diunsaturated lipids in orange, and PUFA-containing lipids in red. (F) Representative snapshots of AdeB and AdeJ trimer conformation from the final 5 μs of simulations in the untreated and DHA-treated membranes. Each protomer is colored differently to aid visualization of protomer interactions from each angle.

