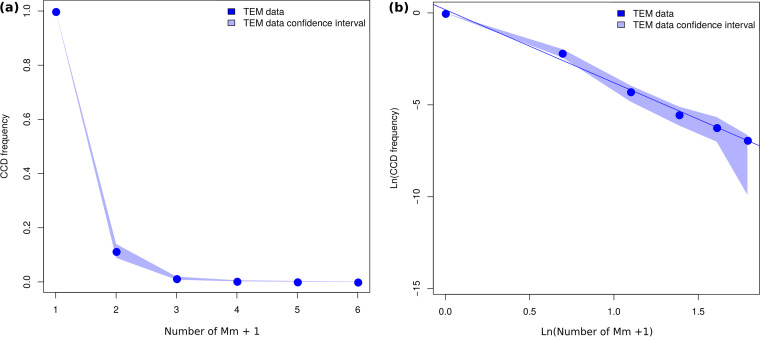
FIG 2.
Complementary cumulative distributions of the different levels of mitochondrial colonization. (a) Complementary cumulative distribution (CCD) of the mitochondrial colonization levels; x axis shows the number of intramitochondrial “Ca. Midichloria mitochondrii” (Mm) plus 1; y axis shows the frequency of mitochondria colonized by at least Mm plus 1 bacteria. (b) Log-log plot of the CCD. The Mm plus 1 scale (i.e., 1 for bacterium-free mitochondria, 2 for mitochondria colonized by one bacterium, and so on) has been used to allow the transformation of the CCD plot to the log-log plot. In both graphs, the line connecting the CCD points is colored blue, while the CCD confidence interval is reported in light blue. This graph shows that the distribution of the frequency of mitochondrial colonization levels follows a power law.

