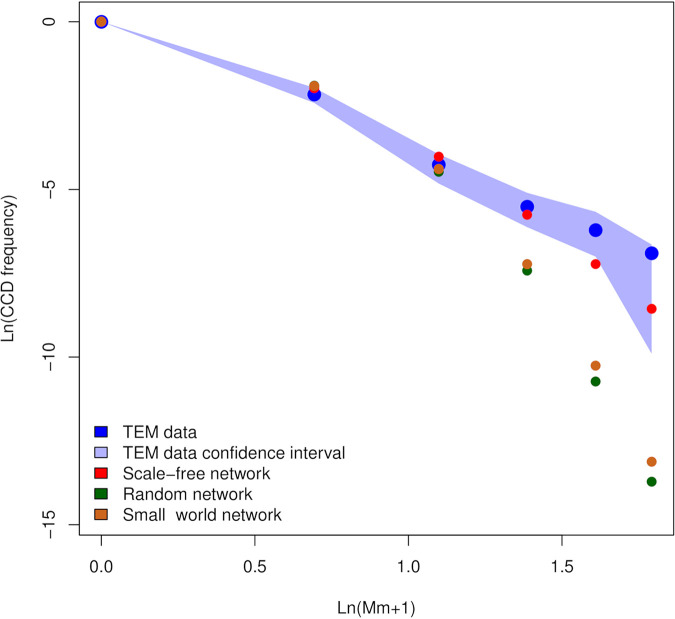
FIG 4.
Complementary cumulative distribution of the different levels of mitochondrial colonization obtained from TEM data and from simulations. The complementary cumulative distribution (CCD) of the mitochondrial colonization levels (i.e., the frequency of mitochondria colonized by at least Mm plus 1 bacteria) obtained from TEM data is reported in blue, and the relative confidence interval is in light blue. The CCDs calculated from the simulations performed to test the mitochondrial network hypothesis on different mitochondrial network topologies are also reported, colored red for scale-free topology, green for random topology, and brown for small-world topology. All the simulations fit well the frequencies of mitochondria colonized by at least zero, one, and two bacteria; indeed, the estimated values fall within the confidence interval of the TEM data. On the other hand, only the simulations of scale-free networks fit well the frequencies of mitochondria colonized by more than two bacterial cells.

