FIG 3.
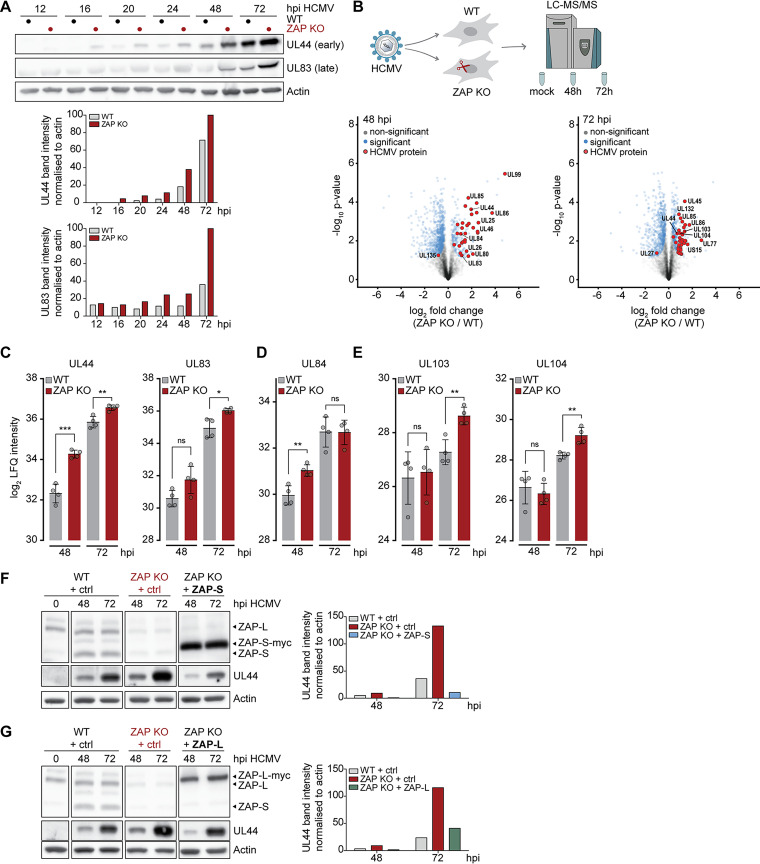
ZAP has a negative impact on early and late HCMV protein levels. (A) WT or ZAP KO HFF-1 cells were infected by centrifugal enhancement with HCMV (MOI 0.1), and lysates were analyzed at the indicated time points postinfection by immunoblotting with specific antibodies against HCMV UL44, HCMV UL83, and actin. One representative experiment performed with three independent ZAP KO cell lines is shown, with similar results in all three experiments. Quantifications of UL44 and UL83 band intensities normalized to actin are represented as bar plots. (B) WT and ZAP KO HFF-1 cells were mock-treated or infected by centrifugal enhancement with HCMV (MOI 0.1), and cell lysates were subjected to total proteome LC-MS/MS analysis at the indicated time points. Represented are volcano plots (x axis, log2 fold change; y axis, -log10 P value) showing differentially expressed proteins at 48 and 72 h post-HCMV infection (unpaired two-sided Student’s t test with permutation-based FDR, 0.05; S0, 0.1). (C to E) Time-resolved expression changes of HCMV UL44 and UL83 (C), UL84 (D), UL103, or UL104 (E) in HCMV-infected WT and ZAP KO HFF-1 cells displayed as bar plots showing the mean ± S.D. of quadruplicates. (F and G) WT, ZAP KO, or ZAP KO HFF-1 cells reconstituted with either ZAP-S (F) or ZAP-L (G) were infected by centrifugal enhancement with HCMV (MOI 0.1), and lysates were analyzed at the indicated time points postinfection by immunoblotting with specific antibodies against ZAP, HCMV UL44, and actin. Quantifications of UL44 band intensities normalized to actin are depicted as bar plots. One representative of at least 2 independent experiments is shown. hpi, hours postinfection. Significant changes were calculated using unpaired two-sided Student’s t tests; n.s., not significant; *, P < 0.05; **, P < 0.01; ***, P < 0.001.

