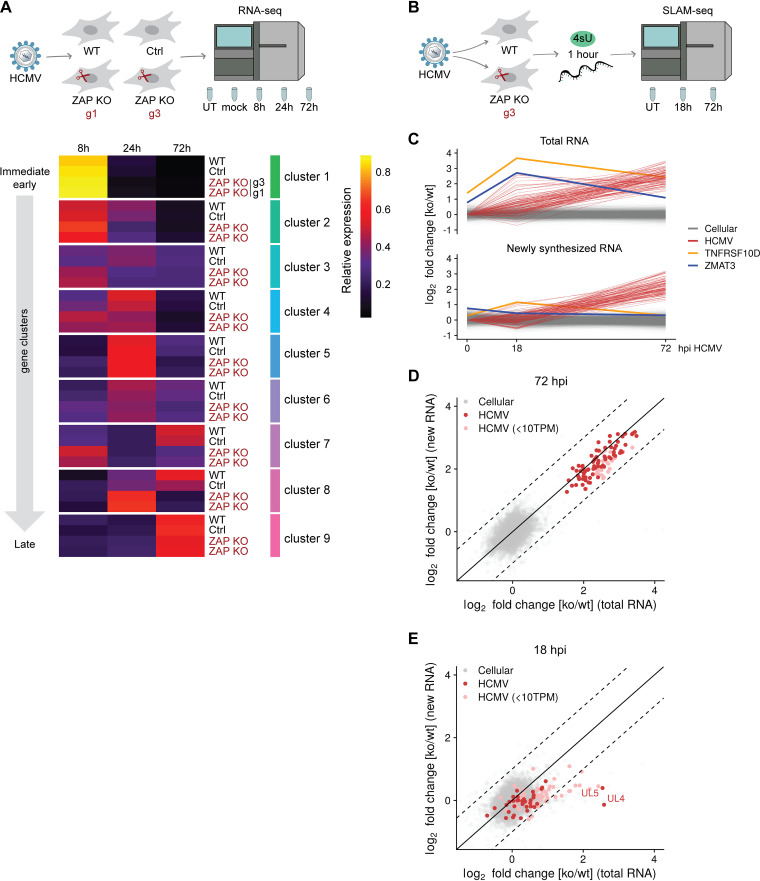
FIG 5.
ZAP decelerates HCMV infection and negatively affects the stability of a subset of HCMV transcripts. (A) WT, control, and two independent ZAP KO HFF-1 cell lines were untreated (UT), mock-treated, or infected by centrifugal enhancement with HCMV (MOI 0.1). Total RNA was extracted at 8, 24, and 72 hpi, and lysates were subjected to total transcriptome analysis. Relative temporal expression levels of gene clusters and selected individual genes are represented as a heat map. Expression of HCMV genes was quantified from the RNA-sequencing and relative temporal expression levels calculated by dividing, per-sample, normalized expression values (fpkm) to the sum of these values from the same gene over all samples/time points. Based on these values, genes were clustered in nine groups representing kinetic classes. Shown are the averages of replicates and clusters. g1, g3, ZAP KO generated with gRNA 1 or gRNA 3. (B) WT and ZAP KO HFF-1 cells were left untreated (UT) or infected by centrifugal enhancement with HCMV (MOI 0.1). Newly synthesized RNA was labeled with 4-thiouridine (4sU) for 1 h prior to cell lysis, and lysates were taken at 18 and 72 hpi, followed by RNA purification. SLAM-seq was performed to identify newly synthesized and total RNA using GRAND-SLAM. (C) Time courses of log2 fold changes of cellular and viral genes (n = 12,652) for total (upper panel) and newly synthesized (lower panel) RNA in ZAP KO/WT HFF-1 cells. The values represent the mean of two biological replicates. TNFRSF10D and ZMAT3 are indicated in yellow and purple, respectively. (D and E) Represented are log2 fold changes of cellular and viral genes (n = 12,652) for total (x axis) and newly synthesized RNA (y axis) at 72 (D) and 18 hpi (E). Values represent the mean of two biological replicates. Weakly expressed viral genes are indicated (<10 TPM). Dashed lines demarcate 2-fold differences in regulation of total versus newly synthesized RNA. hpi, hours postinfection; TPM, transcripts per million.

