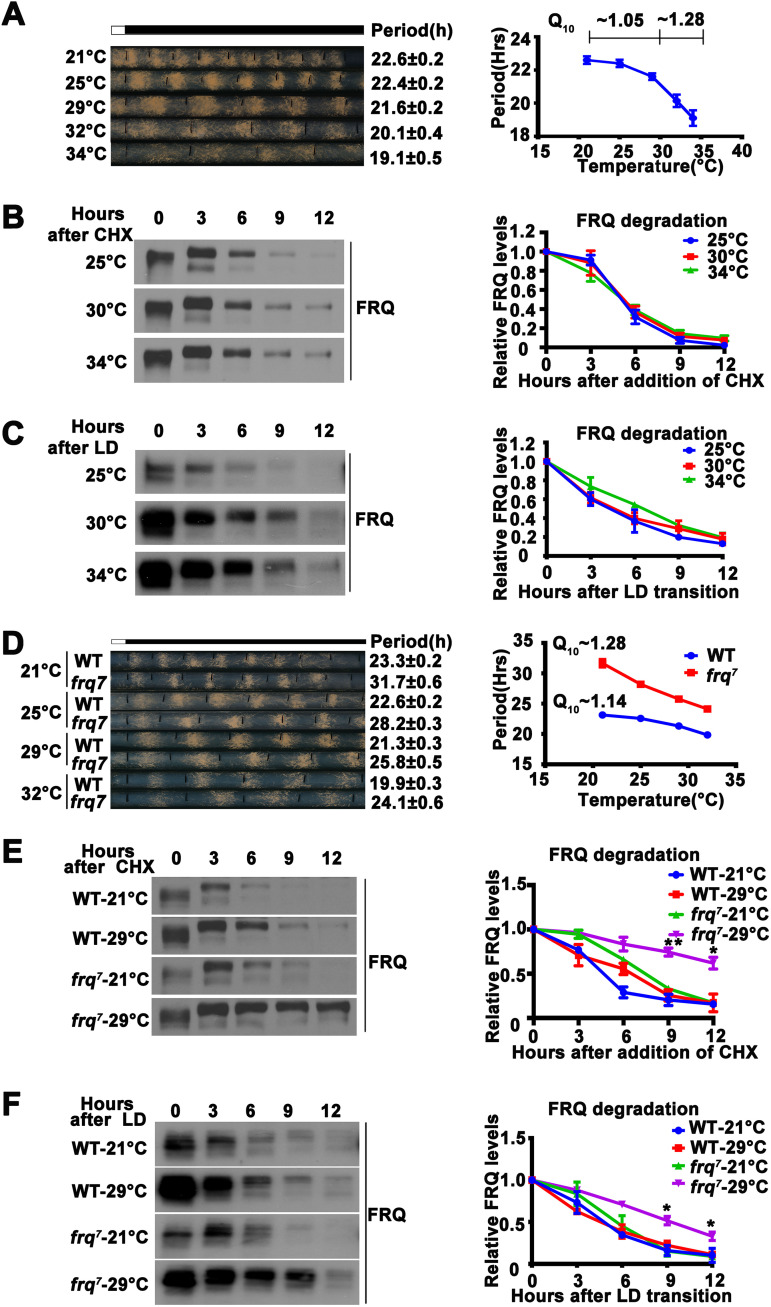
FIG 1.
Altered FRQ stability is not responsible for temperature compensation. (A, left) Representative photographs of race tubes used to evaluate circadian conidiation rhythm of the wild-type strain at indicated temperatures. Periods are given to the right. (Right) Plot of period versus temperature. Error bars are standard errors of means (n = 5). (B, left) Image of Western blot for FRQ from the wild-type strain grown in constant light at the indicated temperatures for the indicated number of hours after CHX addition. (Right) Plot of relative FRQ level as a function of time after CHX addition over a range of temperatures. Error bars are standard deviations (n = 3). The levels of large and small forms of FRQ due to alternative splicing and their various phosphorylated species were used for quantification. (C, left) Image of Western blot for FRQ from the wild-type strain grown in constant light for one day, transferred into constant darkness, and harvested at the indicated time. (Right) Plot of relative FRQ level as a function of time after light/dark (LD) transition over a range of temperatures. Error bars are standard deviations (n = 3). (D, left) Representative photographs of race tubes used to evaluate circadian conidiation rhythms of the wild-type (WT) and frq7 strains at the indicated temperatures. Periods are given to the right. (Right) Plot of period versus temperature. Error bars are standard errors of means (n = 5). (E, left) Image of Western blot for FRQ from wild-type and frq7 strains grown in constant light at 21 and 29°C for the indicated number of hours after CHX addition. (Right) Plot of relative FRQ quantity as a function of time after CHX addition over a range of temperatures. Error bars are standard deviations (n = 3). (F, left) Image of Western blot for FRQ from wild-type and frq7 strains grown at 21 and 29°C for the indicated number of hours after LD transition. (Right) Plot of relative FRQ quantity as a function of time after LD transition over a range of temperatures. Error bars are standard deviations (n = 3). *, P < 0.05; **, P < 0.01; Student’s t test.

