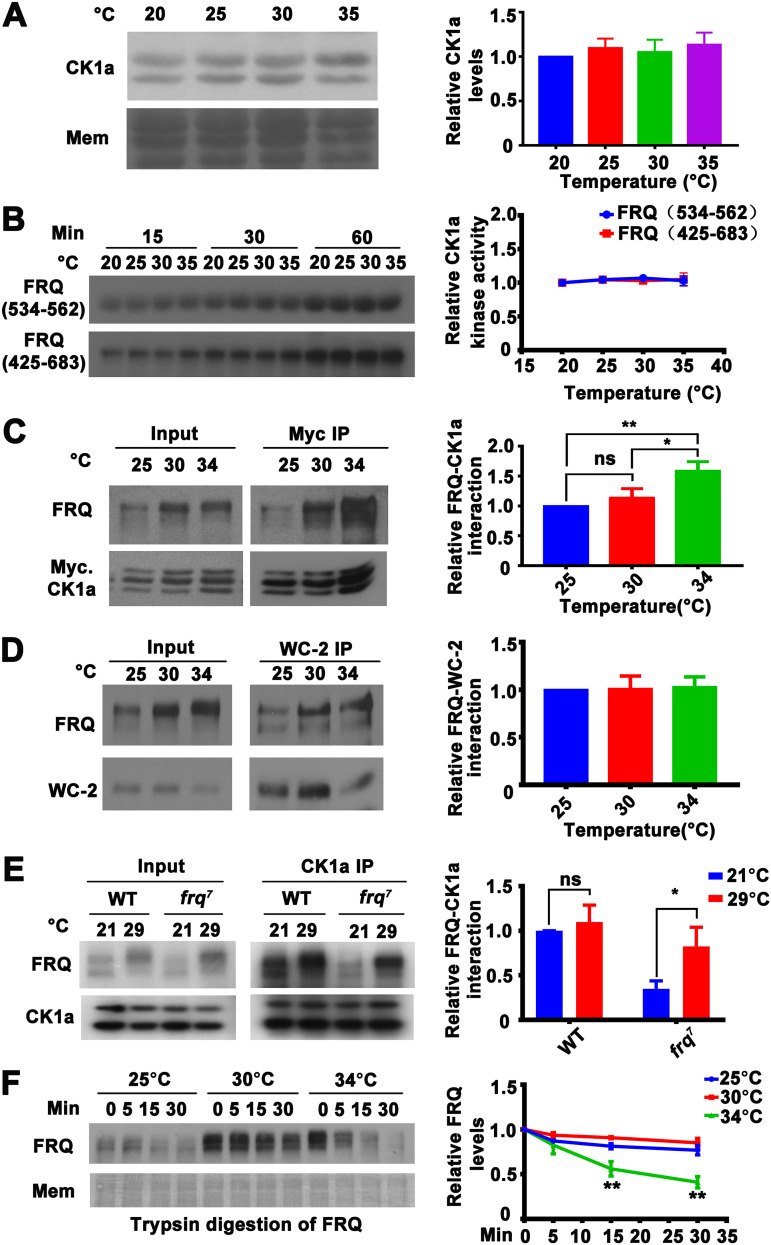
FIG 3.
Temperature sensitivity of the FRQ-CK1a interaction explains the temperature compensation profiles of the wild-type and frq7 strains. (A, left) Western blot analysis for CK1a and stained membrane (MEM) (loading control) in extracts of the wild-type strain grown at the indicated temperatures. (Right) Plot of the relative CK1a levels as a function of temperature. Error bars are standard deviations (n = 5). (B) In vitro kinase assay showing the phosphorylation of GST-FRQ (534-562) and GST-FRQ (425-683) by recombinant His-CK1a at different temperatures. Error bars are standard deviations (n = 3). (C, left) Western blot analysis for FRQ precipitated with Myc-CK1a from extracts of Neurospora cultures grown in constant light at the indicated temperatures in the presence of quinic acid (QA). (Right) Plot of the relative amount of FRQ-CK1a complex as a function of temperature. Quantification of relative FRQ-CK1a interaction levels is based on the ratio of IP to input and normalized to CK1a level. Error bars are standard deviations (n = 3). ns, not significant; *, P < 0.05; **, P < 0.01; Student’s t test. (D, left) Western blot analysis of WC-2 immunoprecipitates from the wild-type strain grown at the indicated temperatures and analyzed for FRQ and WC-2. (Right) Relative amounts of FRQ precipitated with WC-2 as a function of growth temperature (n = 6). Quantification of relative FRQ-WC-2 interaction levels is based on the ratio of IP to input and normalized with WC-2 level. (E, left) Western blot analysis for FRQ precipitated with endogenous CK1a from extracts of the wild-type and frq7 strains grown in constant light at 21 and 29°C. (Right) Relative amount of FRQ-CK1a complex at 21 and 29°C. Quantification of relative FRQ-CK1a interaction levels is based on the ratio of IP to input and normalized with CK1a level. Error bars are standard deviations (n = 5). ns, not significant; *, P < 0.05; Student’s t test. (F) Western blot analysis of FRQ from extracts of the wild-type strain grown in constant light at the indicated temperatures and subjected to partial trypsin digestion. Error bars are standard deviations (n = 4). **, P < 0.01; Student’s t test.

