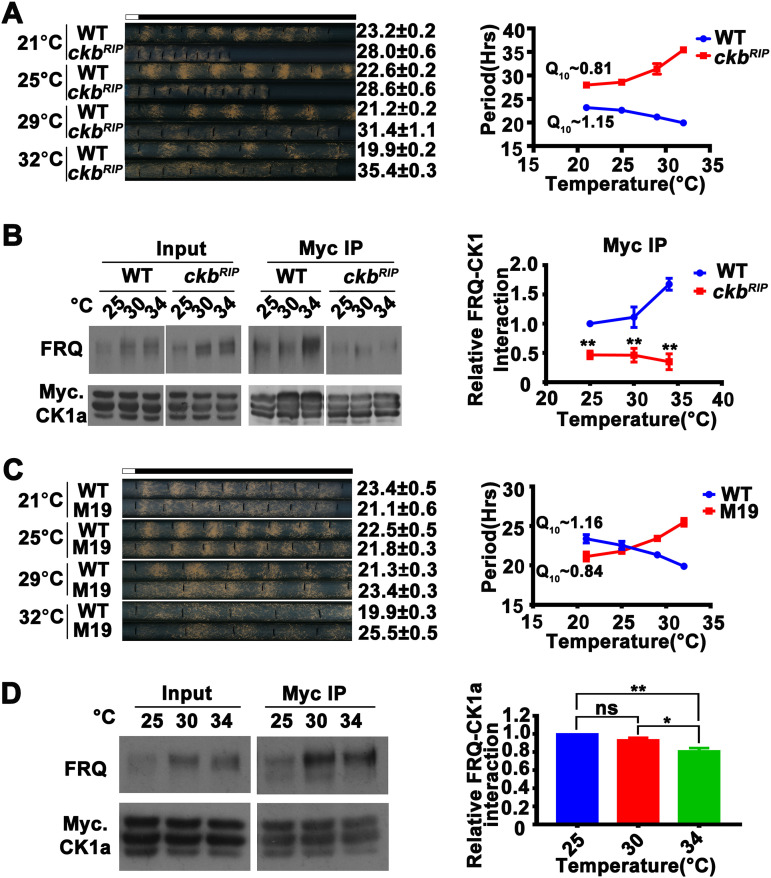
FIG 4.
Temperature sensitivity of the FRQ-CK1a interaction results in the temperature overcompensation phenotype of the ckbRIP strain and CK2 phosphorylation sites of FRQ mutants. (A, left) Representative photos of race tubes used to evaluate conidiation rhythms of the ckbRIP strain. (Right) Plot of period versus temperature for wild-type and ckbRIP strains. Error bars are standard errors of means (n = 5). (B, left) Western blot analysis for FRQ precipitated with Myc-CK1a from extracts of the wild-type strain and the ckbRIP strain that expresses Myc-CK1a grown in constant light at the indicated temperatures in the presence of quinic acid. (Right) Plot of the relative amount of FRQ-CK1a complex as a function of temperature. Quantification of relative FRQ-CK1a interaction levels is based on the ratio of IP to input and normalized with CK1a level. Error bars are standard deviations (n = 4). **, P < 0.01; Student’s t test. (C, left) Representative photos of race tubes used to evaluate conidiation rhythms of the wild-type (frq complementation strain) and M19 strains. (Right) Plot of period versus temperature for wild-type and M19 strains. Error bars are standard errors of means (n = 4). (D) Myc-CK1a immunoprecipitation assays showing that the FRQ-CK1a interaction is temperature overcompensated in the M19 strain that expresses Myc-CK1a grown in constant light at the indicated temperatures. Quantification of relative FRQ-CK1a interaction levels is based on the ratio of IP to input and normalized with CK1a level. Error bars are standard deviations (n = 3). *, P < 0.05; **, P < 0.01; Student’s t test.

