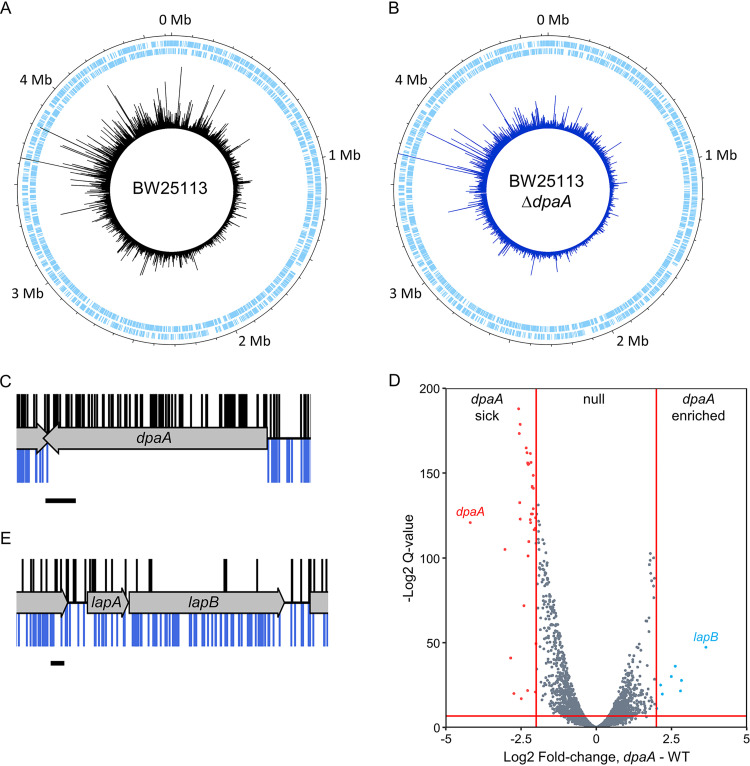
FIG 2.
Comparison of the read depth between genes in each transposon library. (A and B) Genome maps representing the transposon mutant libraries constructed in BW25113 (A) and BW25113 ΔdpaA (B). The sense and antisense coding sequences are displayed in the two outermost tracks, respectively, in pale blue. The position and frequency of transposon insertion events around the BW25113 reference genome are represented by the peaks in the innermost track, plotted using DNAPlotter with a window size of 1 and a step size of 1. (C) Insertion profile of dpaA. (D) Volcano plot showing a comparison of the relative mutant abundance between libraries. Genes with a >2-fold change in read abundance and with a q value of <0.01 (see Materials and Methods) are colored; these thresholds are represented as solid red lines. WT, wild type. (E) Insertion profile of the lapAB operon. In panels C and E, the transposon insertion sites identified in the control library are displayed above the gene track (black) and transposon insertion events in the dpaA library are shown below the gene track (blue). The insertion plot is capped at a read frequency of 1. Scale bar = 100 bp.

