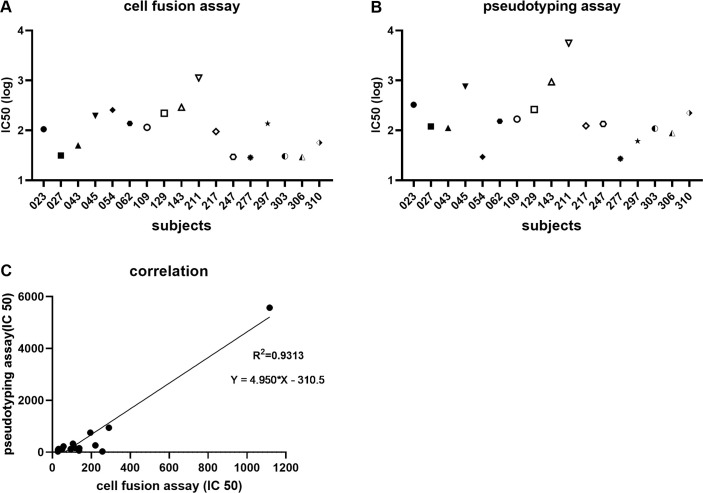
Fig 5. Correlation between the cell fusion and pseudotyping assays.
IC50 values of the 17 serum samples to inhibit cell-cell fusion between TZMbl-Spike producer and HOS-3734 target cells are shown; note log scale of Y-axis (A). IC50 values of the 17 serum samples to inhibit pseudotying virus entry are shown (B). Correlation between cell fusion and pseudotyping IC50 values (C).

